How to investigate a drop in your website traffic?
If you are noticing your website traffic is down, the first thing to do is investigate the reasons. Don’t panic, you were probably hit by a Google’s core update, something maybe off on the technical side, the site may be responding to a new trend, or you may simply need to write more/better content.
Interestingly, at the time of writing this post, we are also noticing a drop in our website traffic for the last 30 days. This compelled me to investigate on our end too and opened the perfect opportunity to cover this topic.
To do this, you need a web analytics tool, and if the situation demands, access to your SEO tool (or other similar free alternatives) and Google webmaster tools.
By taking you through the things you can do on such tools and taking our own investigation as an example, we will demonstrate how to diagnose the issues causing your website’s traffic to decline.
- Analyzing the traffic drop
- Analyzing an organic search drop
- Concluding investigation
- How much traffic drop is too much drop?
- You’re in good hands
Analyzing the traffic drop
There are mainly five things you need to check to analyze your traffic drop, as defined in the five sections below. This can be applied to any web analytics tool you are using.
We used our Plausible dashboard for this analysis. However, if you’re using a different tool like Google Analytics, we have mentioned the equivalent reports in GA4 to access the same information.
Let’s begin.
Determine if it’s a drop or a trend
The first thing to do is try and understand whether your traffic has been declining for a while or are you experiencing a sudden drop for a day or two?
If you are experiencing a sudden drop, do check out the Google Search status page to see if there are any crawling, indexing, or similar issues from Google’s side. And then, align the dates in the reported incidents with the dates in your web analytics tool.
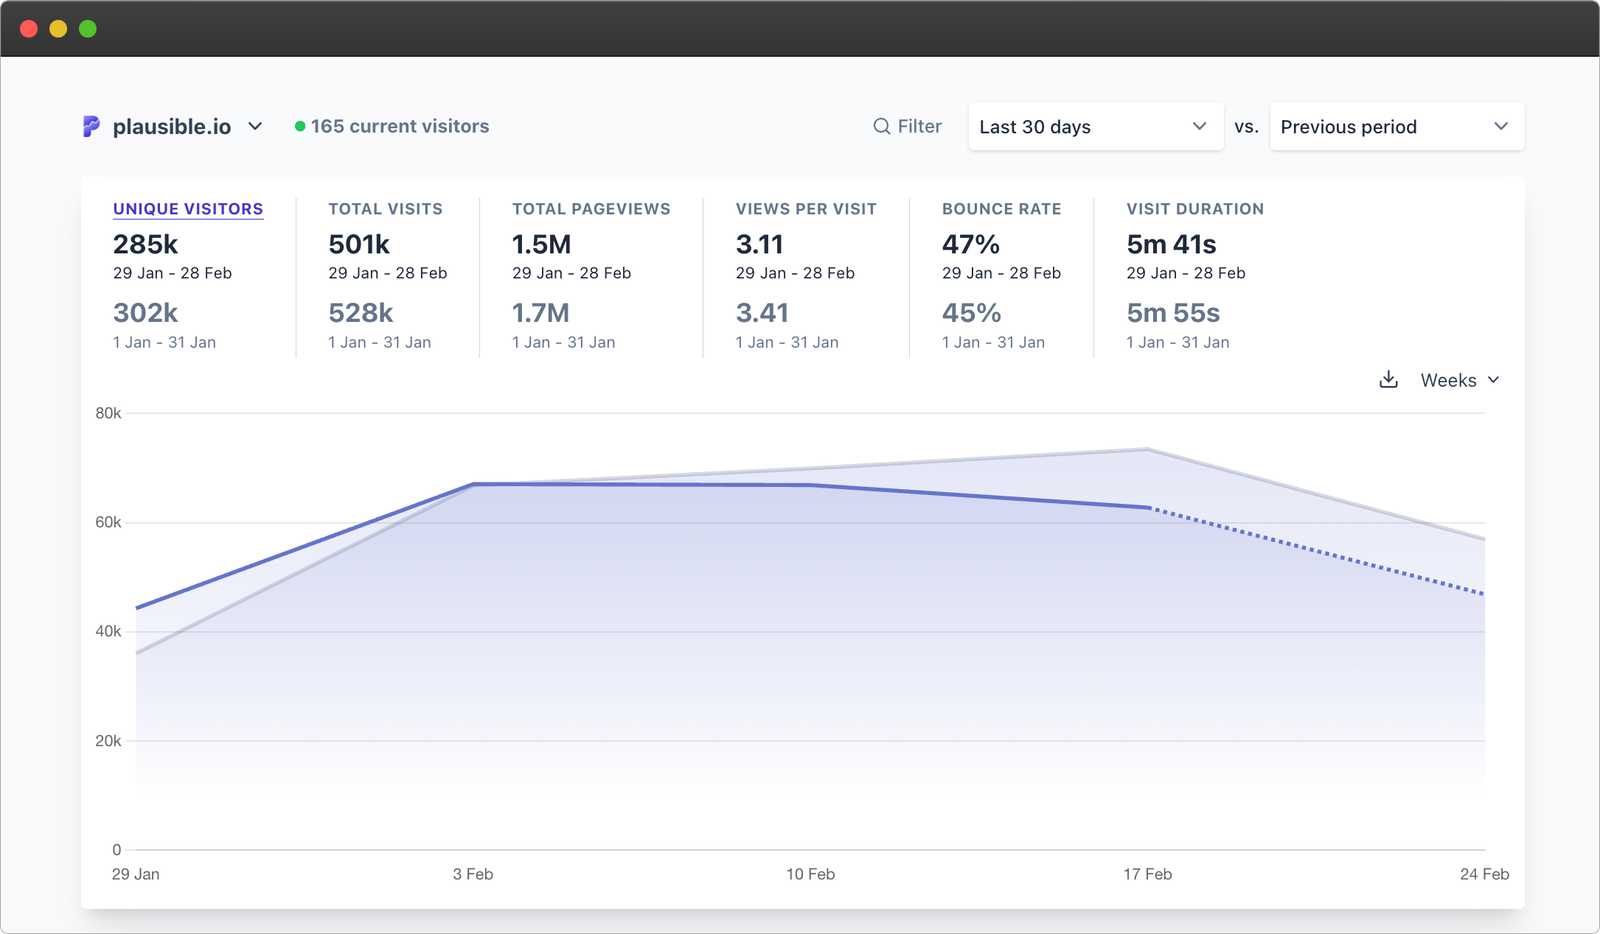
Taking our own traffic-drop example, I was noticing a drop for the past 7 days and 30 days time period. I switched on our comparative view to compare the data on the last 30 days with the period of 30 days prior to that:

As you can see, while our unique visitors and total visits are both down by 3%, our engagement metrics like views per visit, bounce rate and visit duration have declined a bit too.
That’s the first clue: since people have been visiting fewer pages in a visit, spending less time on the site and bouncing off more, something might be off with the content.
I repeated the same exercise for the past 7 days and the drops are still there. When I check for the “year to date” time period (i.e. effectively, past 2 months), the traffic arrows are green again.
So I am also compelled to check for the past 12 months altogether to understand if there are bigger things to worry about and that showed improvements upwards of 50% so we should be good. There’s nothing big to worry about.
A couple of tips if you’re a Plausible subscriber:
- You can send custom properties along with your pageview or custom goals to determine, for eg., if specific actions taken by logged-in users. The Plausible dashboard can be just filtered by properties too, so you’ll be able to make a more nuanced analysis. You can even compare the trend for logged-in vs logged-out visitors.
- You can set traffic drop notifications by determining your 12 hour visitor threshold.
Where to find this info in GA4?
Here’s a detailed explanation.
See which traffic channels are contributing to lower traffic levels
In Plausible, you can see a straightforward Channels tab. You can check out what each channel means here.
Using GA4? You can open your “Traffic Acquisition” standard report and continue investigating using the same principles we describe below.
To investigate, see which channels are showing a decline. In Plausible, it’s indicated by the red, downward arrows.
Upon hovering over any such arrow, you’ll be able to see the drop in percentage as well. How to comprehend that?
- If your Direct traffic has been hit, you can investigate, for instance, if your brand’s popularity recently went down due to some new competitors.
- If your organic traffic is down, it could be a content quality or technical SEO issue or probably even the AI wave eating up your organic traffic.
- If your referral traffic has dropped, you can zero down on which exact ones are these and what must have happened on their end.
…and so on.
You can also click on any such Channel to see the exact sources within each channel (eg. Twitter, Reddit, LinkedIn, etc., in organic social) along with their respective traffic contributions as well as changes compared to previous period.
For us, out of the top four significant channels, organic search, referral and organic social are the three with declines.

Referrals is something we don’t try to typically influence or buy, so it may not be worth investigating that further. If anything, producing content is the way to go for us so we continue investigating the other two declining channels: organic search and organic social.
If I segment the dashboard by clicking on “Organic Search,” it is seen that Google, DuckDuckGo, Brave, etc., have contributed to the drops. Out of these, Google is the most significant traffic contributor.

As for organic social traffic, the significant one is GitHub. Out of the channels that we actively post in, only LinkedIn seems to be having a drop, while the absolute numbers are only in hundreds.

Also, a little decline in organic social traffic is natural because it’s a well-known fact that social media algorithms these days try to prevent people from exiting their platform.
Interested people do make it to a website through the links in your profile’s description or when you post something truly interesting but it’s tougher to get organic social traffic nonetheless.
Since the biggest culprit until now seems to be Google search traffic, it’s possible to drill further down by seeing the exact search terms that bring Google traffic to you. This is available in the Plausible dashboard through a GSC integration, or you can simply open up your Search Console in another tab.
It could also be an algorithm update, lost backlinks or technical issues with crawling. We have a whole section on analyzing an organic search drop down below, but first let’s check the other reports for more information and eliminate any other possibilities.
Which pages are affected?
This information is available in Plausible Analytics’ Entry Pages tab and it can help spot the exact landing page or pages seeing the drop.
Using GA4? You can open your “Landing Pages” standard report and continue investigating using the same principles we describe below.
If you are seeing a pattern in such pages or only see specific 4-5 pages with significant drops, you could instantly get closer to the reason. For eg.,
- If you see that a blog post is seeing a traffic drop this month as compared to last month and you know that it was going viral last month, then the drop is natural and you probably don’t have much to worry about. Or if that wasn’t the case, you can check the specific blog post for any SEO issues like drop in rankings, outdated content, or any technical issues.
- If you see a pattern in the kind of pages seeing a drop, such as the pages in your SaaS app, you can compartmentalize better and know that you likely need to turn your eyes to your product marketing efforts.
For us, upon checking the Entry Pages (i.e. landing pages) report, almost all the pages have seen a drop. So it’s a sitewide thing and a single page or pattern can’t be held culprit.
This means that only the traffic sources side of the equation is affected, as we didn’t make any recent changes on the website either.
Could this be a geographical or devices related thing?
This information is available in the Locations and Devices sections in Plausible.
Using GA4? You need to select country, region, city as a primary and/or secondary dimension in Demographic reports –– one at a time. Same thing needs to be done for getting the Browser, OS, device info, etc., within the “Tech details” report.
To analyze,
- If you see certain regions with drops, you’d know where to turn your eyeballs to.
- If you see specific devices or OS with drops, then you can check for technical issues. For eg., a sudden drop in traffic from mobile phone users could mean that your site is not accessible on phones anymore. In this case, get your tech team involved.
In our case, our top five countries are consistent regardless of whether we apply the filters of organic search and organic social channels or not. So, keeping focused on the so-far observed organic traffic-drop would be enough.
Similar is the case with our devices report. The browser, OS, size data is also just a reflection of what our visitors use and don’t tell anything new about the traffic drop.
So, that’s eliminated.
Is it a “time of the year” thing?
If you are investigating a traffic drop in February, what was happening in February last year? This information can also be pulled from the Plausible Analytics dashboard (provided you were using it a year ago too).
Here’s what to do:
➡ ️ Choose a custom range (or press ‘C’) and set February 2024 (as per this example).
➡ ️ Select “previous period” in the vs dropdown.
For us, no significant pattern emerged. And we know that we are not a seasonal business so it does not apply to us.
Using GA4? Use different time ranges, such as past months, or corresponding dates from previous years to account for seasonality. This will help identify trends and significant shifts in user behavior or traffic sources.
Analyzing an organic search drop
The conclusion so far in our personal investigation is that Google search traffic is the main culprit for causing a drop in traffic for the Plausible site.
This is also one of the most common reasons for seeing a drop in traffic so it’s worth checking the following while investigating any traffic fluctuations.
Check if Google penalised the site
To check if Google has issued a manual penalty to your site, you can check for any notifications in Google Search Console. You can also check the Security and Manual actions section in the Console for any detected issues. We did this for Plausible and found no such penalties.

There are also algorithmic and site-wide penalties. Algorithmic penalty is something that causes a drop in your rankings if you don’t follow Google’s guidelines.
A site-wide penalty is severe and usually causes the entire site to be marked as spam and be deindexed. A quick way to rule this out is to go to Google and type “site:domain keyword” and swap the keyword with a main search term usually used for your site.
If Google search results return no or less than normal search results for your site, you may be battling with a partial or full site penalty.
As for us, that’s not the case. The next thing to do is check for lost keywords, backlinks, broken links, and/or rankings.
Check with an SEO tool
Many SEO tools provide an option to conduct a site audit which is the fastest way to come across any lingering issues. Other than that, look at your keywords and backlinks reports.
Here’s what I found from our Keywords report after sorting it by lost traffic column (Look at the orange “Change” column):

The first row shows us losing traffic (by 83) and ranking (by 13) for the keyword, “as goals”. But that’s a good thing because it’s not a relevant keyword, and this drop actually leaves us with quality traffic only!
As for the next keywords like “google analytics alternatives,” “self hosted analytics,” etc., I did a manual Google search from our top 5 countries to find out if we really did drop in rankings and that wasn’t the case for my search at least.
So why is this tool showing a drop in rankings? It’s difficult to pinpoint. It could be a one-off thing, maybe Google algorithm knows that I prefer Plausible as a search result, or the changes have been reset now.
It at least doesn’t matter at this point because we know there’s nothing much to do on our end.
I also checked our Backlinks report (a popularly considered SEO ranking factor) and it shows a decline too but we never trade in backlinks and it’s all organic for us so we believe this will recover on its own.
However, if you notice a decline and have an SEO team or an SEO strategy, you can improve your backlinking efforts.
Confirm there are no technical issues
Technical SEO, or general technical health of a website, ensures that search engines can efficiently crawl, index, and render a website. Slow site speed, indexing issues, crawl errors, server errors, etc., are all factors that can affect your site’s technical health.
There’s a good guide by Semrush if you want to get deeper into this, but a quick and comprehensive way to check for any technical issues is to run an audit with your SEO tool.
If you don’t pay for an SEO tool, you can use Lighthouse Metrics. Simply add a page URL from your site and you can get performance scores on its metrics like first contentful paint, speed index, etc.
You can also see areas for improvement on accessibility and SEO. Any score in green is good.

If the issues seem to be of a larger scale, it’ll become important to involve your engineering team.
Concluding investigation
Luckily, we didn’t have much to worry about. We will continue doing what we do with our content marketing while maintaining content quality. If you do happen to find anything worrisome, that’s not too bad because now you are not operating in the dark and can take corrective measures.
But it’s worth taking a sanity check…
How much traffic drop is too much drop?
This depends on:
Your normal traffic levels
If you have 100 visitors in a month and notice a 3% drop, then that’s probably nothing to worry about since you’re still very close to your average. But if you have 1M visitors, and you see a 3% drop, that means you’re down to 970K visitors –– a loss of 30K visitors.
The same 3% drop can mean very different things for different traffic levels. So do look at absolute traffic levels too before getting overwhelmed with red, downward arrows. :)
A small dip might be statistically insignificant for smaller websites, while for high-traffic sites, even a seemingly small percentage loss can translate to substantial revenue and engagement losses.
Industry and industry trends
A 10% drop for a SaaS business can be considered bad. Many SaaS companies rely on steady, predictable growth, and a sharp drop could signal problems such as customer churn, shifting market trends, or increased competition.
Meanwhile, a 10% drop for a news site that thrives on viral content may not be as concerning, especially if the dip coincides with fewer trending stories or seasonal variations.
Some industries naturally experience fluctuations due to external factors. For example, travel websites might see a dip in off-peak seasons, while e-commerce stores often see drops after big sales events like Black Friday.
Personal goals and observations
It’s also essential to align expectations with personal goals. If your aim is aggressive growth and you see even a slight dip, it might warrant an investigation. But if you’re maintaining steady traffic levels without significant business impact, a small drop may not be alarming.
For instance, even if your traffic has dipped but conversion rates on important goals (like sign ups or purchases) haven’t, it’s alright.
Whether the drop is obvious
No matter how much your traffic numbers are, a 50% drop can’t be good (unless there’s a strong reason such as being in a seasonal business).
A sudden, significant drop often signals a major issue—like a Google penalty, site indexing problems, technical errors, or an algorithm update. If you see such a drastic decline, immediate action is necessary to diagnose and fix the problem.
In cases where seasonality is a factor, a steep drop might be expected. For instance, a tax-related website might see traffic plunge after tax season ends.
However, if the decline is unexpected and sustained, it’s a red flag that warrants deeper investigation into possible causes like ranking drops, content performance, or shifts in audience interest.
You’re in good hands
Fret not, traffic fluctuations are a natural part of site ownership. With the right tools and consistent monitoring, you can quickly identify dips and take corrective action as needed.
If you’re seeing the opposite pattern, here’s how to investigate a spike in website traffic.
If you want to try out an extremely simple way of tracking traffic and ditch Google Analytics, do sign up for our free trial and join our 19,000 happy subscribers.
We are privacy-friendly and GDPR-compliant by default, our tracking code is less blocked by ad blockers, we automatically keep bot traffic at bay, and are proud to be a more accurate alternative to Google Analytics.
Good luck!