What's new in Plausible Analytics
Plausible is updated multiple times per week. Here we list the major new features and improvements. Take a look at our feedback board to see what's coming next. Follow us on Twitter, Bluesky, Mastodon and LinkedIn for more updates.
-
Strict order funnels for precise path analysis
You can now make your funnels strict.
When enabled, every step must happen in exact consecutive order with no other actions in between.
This is useful when you want to measure a tightly defined path and ensure any detour disqualifies the conversion.
Learn more in our funnel analysis docs.
-
Sort your sites by traffic
If you have multiple sites on Plausible, you can now sort them by:
- Most/least visitors in the last 24 hours
- Domain name (A–Z or Z–A)
Pinned sites would still stay on top. Visit your All Sites page to try.
-
Last 24 Hours
A new time range for “Last 24 Hours” is now available on your dashboard. Open the time range picker to select it or press H on your keyboard to switch instantly and see how your site has performed over the past 24 hours.
-
Goals with custom properties
You can now select up to three existing custom properties and values directly in the goal settings. This lets you turn a broad goal into a more specific one, like a Purchase goal for specific subscription plans and payment cycles.
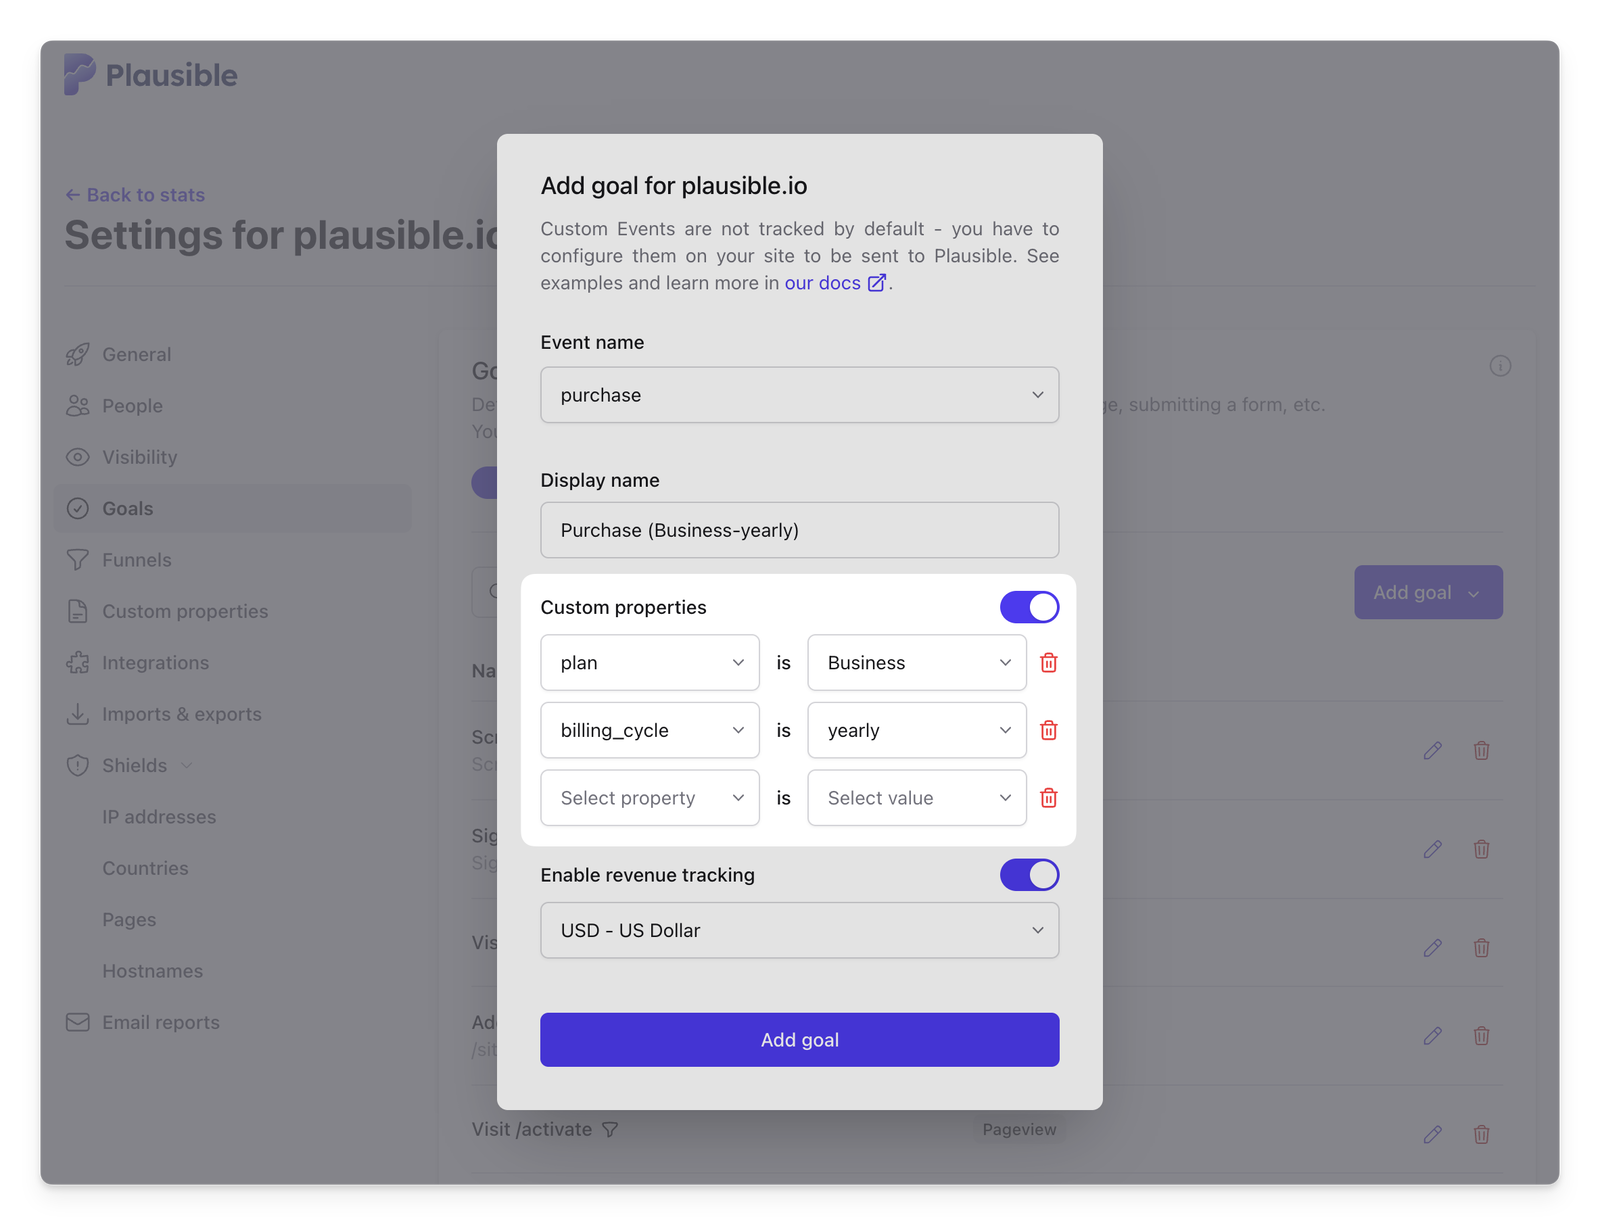
This works with all types of goals: pageview goals, custom events and scroll goals.
Goals with properties behave like built-in segmentsfor your dashboard. These would also help make funnels more precise, since each step can now represent a specific version of a goal instead of a catch all.
P.S. Sending custom properties works exactly as before. You still send them in your goal snippet and can use them for filtering and breakdowns across the dashboard.
Learn more about goals and custom properties.
-
Limited dashboard sharing
Happy new year! Here are a few updates to kick off the new year. 🎈
Limited dashboard sharing
When sharing your dashboard with external parties, you can now choose to show only specific, filtered data, i.e., share only a segment of you stats.
Anyone opening such a shared link will only see that segment and won’t be able to remove it. They would be able to add more filters to drill down further, but they won’t be able to see any data outside the selected segment.
This makes it easy to share only the data you want with the right audience.
Other updates
- You can now see what percentage of your visitors came from different traffic sources, locations, and devices, as well as what percentage visited each page. A percentage column appears when you hover over a report and when the report is expanded.
- Enterprise customers now have the option to access their privacy-friendly event level data with scheduled raw event data exports.
-
Revenue breakdown in your reports
If you track your revenue goals in Plausible, you can now see a breakdown of your revenue within the individual reports as well.
Whenever the revenue goal is applied on your dashboard and you expand any report (by clicking on “Details”), you will find a new “Revenue” column appear. This helps you see exactly which traffic sources, top/entry/exit pages, locations, browser/OS/device types, and custom properties contributed to how much revenue and make judgements on what drives value best.
-
Introducing, Consolidated Views
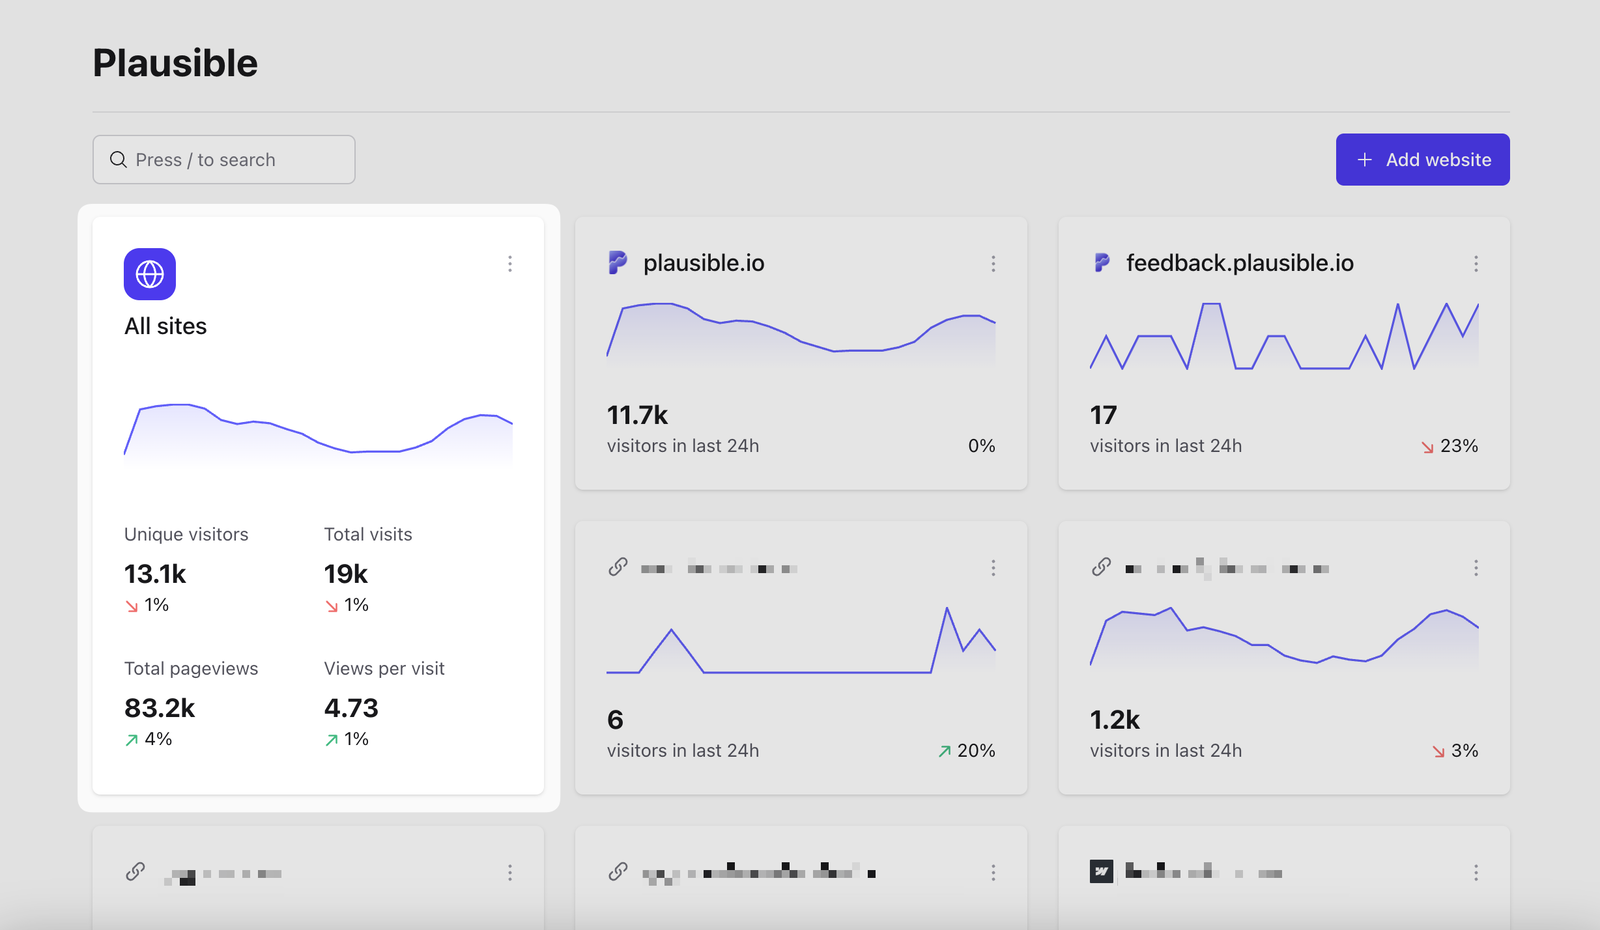
If you have multiple websites/dashboards in your Plausible account, you will find a brand new consolidated view on your All Sites page.
This gives you an overview of traffic across all your websites, allows you to quickly see the total number of visitors and other key metrics across all your properties in one place and works like any other dashboard that you can access and change the settings of. Find full info here.
-
Team owners can now enforce 2FA for extra security, and our security practices
We’ve made security in Plausible even stronger.
New: Team owners can now make two-factor authentication (2FA) mandatory for all members. This helps teams keep their accounts and data even more secure. You can manage your team’s 2FA settings in the Team Settings section. Everything you need to know is here.
Overview: We take security very seriously, here’s a reminder of everything you can do to keep your account secure:
- Manage active sessions: View and remotely log out of any device from your account settings. All sessions automatically expire after 14 days of inactivity.
- Password protection: If you change your password, Plausible automatically signs you out of all other devices to keep your account safe.
- Single Sign-On (SSO): Teams on eligible plans can enable SSO to make logging in simpler and more secure.
Beyond account-level security, we follow strict best practices: we don’t use cookies, don’t collect personal data, and encrypt all data in transit and at rest. We’re also fully GDPR, CCPA, and PECR compliant. Learn more about how we keep your data safe here.
P.S. We’ve also made the dark theme even darker. If you prefer dark mode, give it a try!
-
Plug-and-play setup for optional measurements, automatic form analytics, and more
We have so many updates to share with you!
1. Brand new Plausible script for easier setup and more flexibility
The new Plausible script makes managing your analytics easier than ever. You can now enable or disable optional measurements (like outbound link clicks, file downloads, and form submissions) or even change your site’s domain — all without changing your site snippet again.
If you’re using the previous script, you’ll need to update to this new version once to take advantage of these improvements.
2. Introducing, automatic form submission tracking
Form submissions tracking is now available as an optional measurement to track. Just toggle on to start tracking.
Plausible automatically detects and records all form submissions across your site, making it easy to measure signups, contact form conversions, etc.
3. Official Google Tag Manager template
If you prefer installing/managing Plausible using Google Tag Manager, it’s now way easier to do that.
We’ve launched our official GTM template, allowing you to set up Plausible through Google Tag Manager with a simple, code-free configuration. Best of both worlds!
-
SSO is now available!
Now you can enable SSO for your team on Plausible. SSO gives you a way to access Plausible without having to create a separate account for Plausible and managing additional credentials.
This is possible by first logging in to identity provider (IdP) - be it Google, Okta, Microsoft (Entra) or other - and accessing Plausible through it.
Our SSO implementation is SAML 2.0 compliant and it should be compatible with almost every identity provider as SAML 2.0 protocol is widely supported.
Learn more about the implementation on our docs, contact us for enabling this feature.
-
Introducing, Managed Proxy
If you want your Plausible script to bypass some ad blockers for more accurate stats, you can proxy the Plausible script and endpoint through your own domain name, making it a first-party connection.
What’s new: If you’d rather not deal with managing your own proxy, we can now handle it for you. Just set up a CNAME record using the instructions we’ll send you, update the snippet on your site, and we’ll take care of the rest.
Managed proxy is available on our Enterprise plans, contact us for details.
-
Improved "Time on Page" metric
We’ve made some big upgrades to how the “Time on Page” metric works:
- More accurate tracking: Prior to 1 March 2025, the Time on Page was calculated as the difference between the point a visitor landed on a page and when they moved on to the next page. The new tracking method relies on engagement signals. This allows us to provide you with a more precise and reliable measure of user engagement which includes visitors who bounce away from your pages and which does not include time not spent actively on your pages.
- View it on the top graph: You can now click on the Time on Page metric to see how it trends over time (available for date ranges starting 1 March 2025).
- Sort by it: In the Top Pages Details view, you can now sort pages by Time on Page to quickly see where visitors spend the most (or least) time.
When viewing data for periods before 1 March 2025, the legacy Time on Page metric is displayed along with a note in the tooltip.
-
Create a team in Plausible
It’s now much easier to manage teams on Plausible. You can now:
- Add multiple owners and billing contacts, so you’re not stuck if someone’s away or has left the company.
- Invite multiple people to a site at once.
- Add someone to several sites in one go.
No more one-by-one invites.
You’ll find the new “Create a Team” option in the upper-right menu. You can also view and switch between your teams there — and still access your personal sites under “My Personal Sites”.
Team roles include: Viewer, Editor, Admin, Billing, and Owner.
-
Scroll Depth tracking
The scroll depth metric is now available in your Plausible Analytics dashboard. You can find it in the Top Pages report or in your dashboard’s top row when filtering by a page or pages.
We are tracking this metric automatically for all pages on your site—no setup required. We track scroll depth at all page heights––(1% to 100%).
Introducing, Scroll Depth goals
You can now set up Scroll Depth Goals to track how many visitors reach and exceed a specific scroll depth percentage on your selected pages. Learn more here.
-
Save and reuse segments
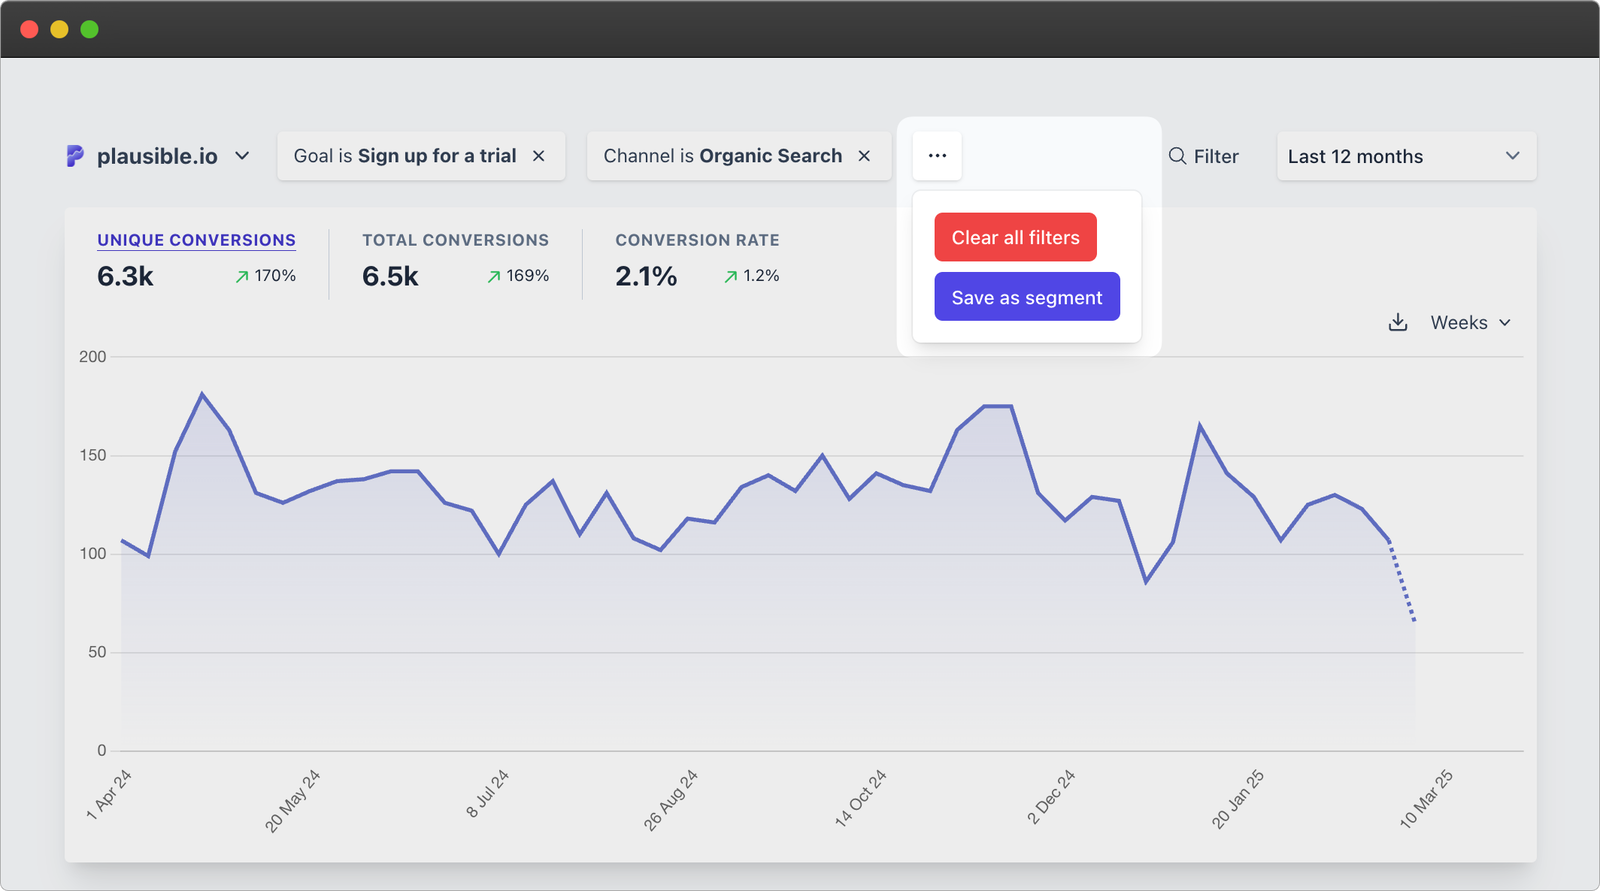
You can now save segments for quick and easy access! When you create a segment using one or more filters, you will find a new option to save it along with a display name (e.g., Organic signups) and access it later from your “Filter” menu.
There are two types of segments you can create:
- Personal Segments – Save segments for your own use.
- Site Segments (business plan) – Share saved segments with your team members.
Learn all details about using saved segments here.
-
Automatically track form completions with the WordPress plugin
We just released version 2.2.0 of the Plausible WordPress plugin. The highlight of this update is you can now track contact form submissions automatically, without any manual tagging or extra setup.
We have verified and tested this tracking with Contact Form 7, WP Forms, Ninja Forms and Elementor Forms but it should work for most other forms plugins as well.
To enable form tracking:
- Go to the “Enhanced measurements” section in the Plausible WordPress plugin settings.
- Toggle on “Form completions” tracking.
Once enabled, all successful form completions will be tracked and displayed in the “Goal Conversions” report in your Plausible Analytics dashboard.
You’ll see a “WP Form Completions” goal appear once the first successful submission is recorded. If you have multiple forms on your site, you can click on this goal to see a breakdown by page.
To learn more about the Plausible WordPress plugin, visit our guide.
-
Exclude goal conversions
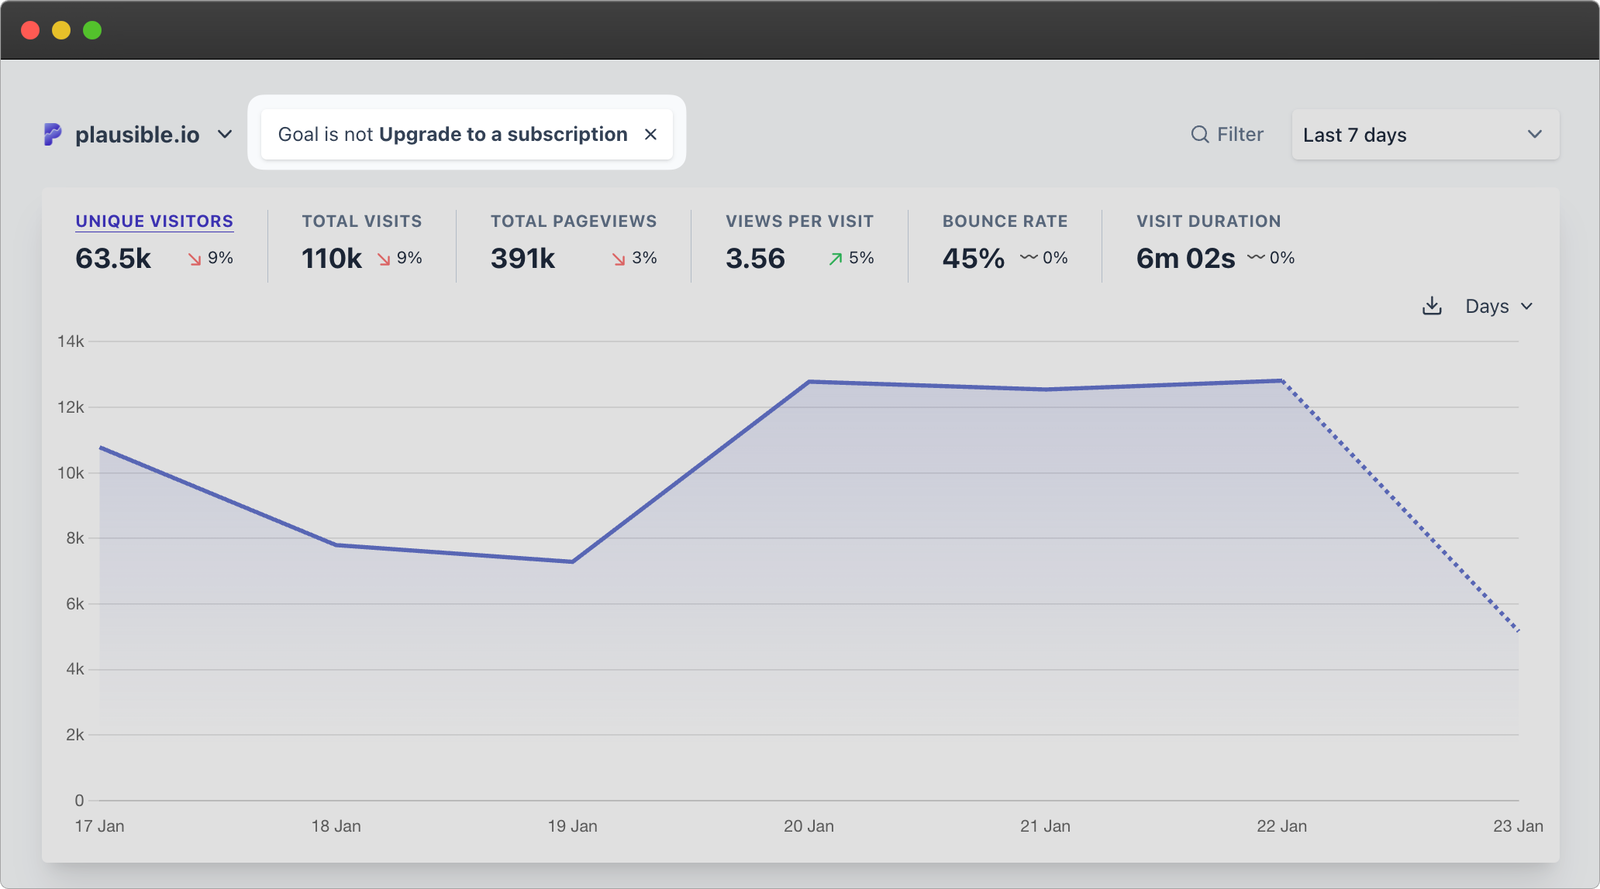
We’ve added a new filter option to the dashboard when analyzing by goals. In addition to the existing “is” and “contains” operators, you can now use the “is not” operator.
This enhancement allows you to segment and analyze those sessions in which visitors didn’t convert on specific goal(s).
-
Plausible Analytics Looker Studio Connector is live!
The official Plausible Analytics Looker Studio Connector is now available!
Easily fetch your Plausible Analytics data using the Stats API and create custom, dynamic reports directly in Google Looker Studio.
Find the official connector here. Get started with our setup guide.
-
Introducing Top Channels Report
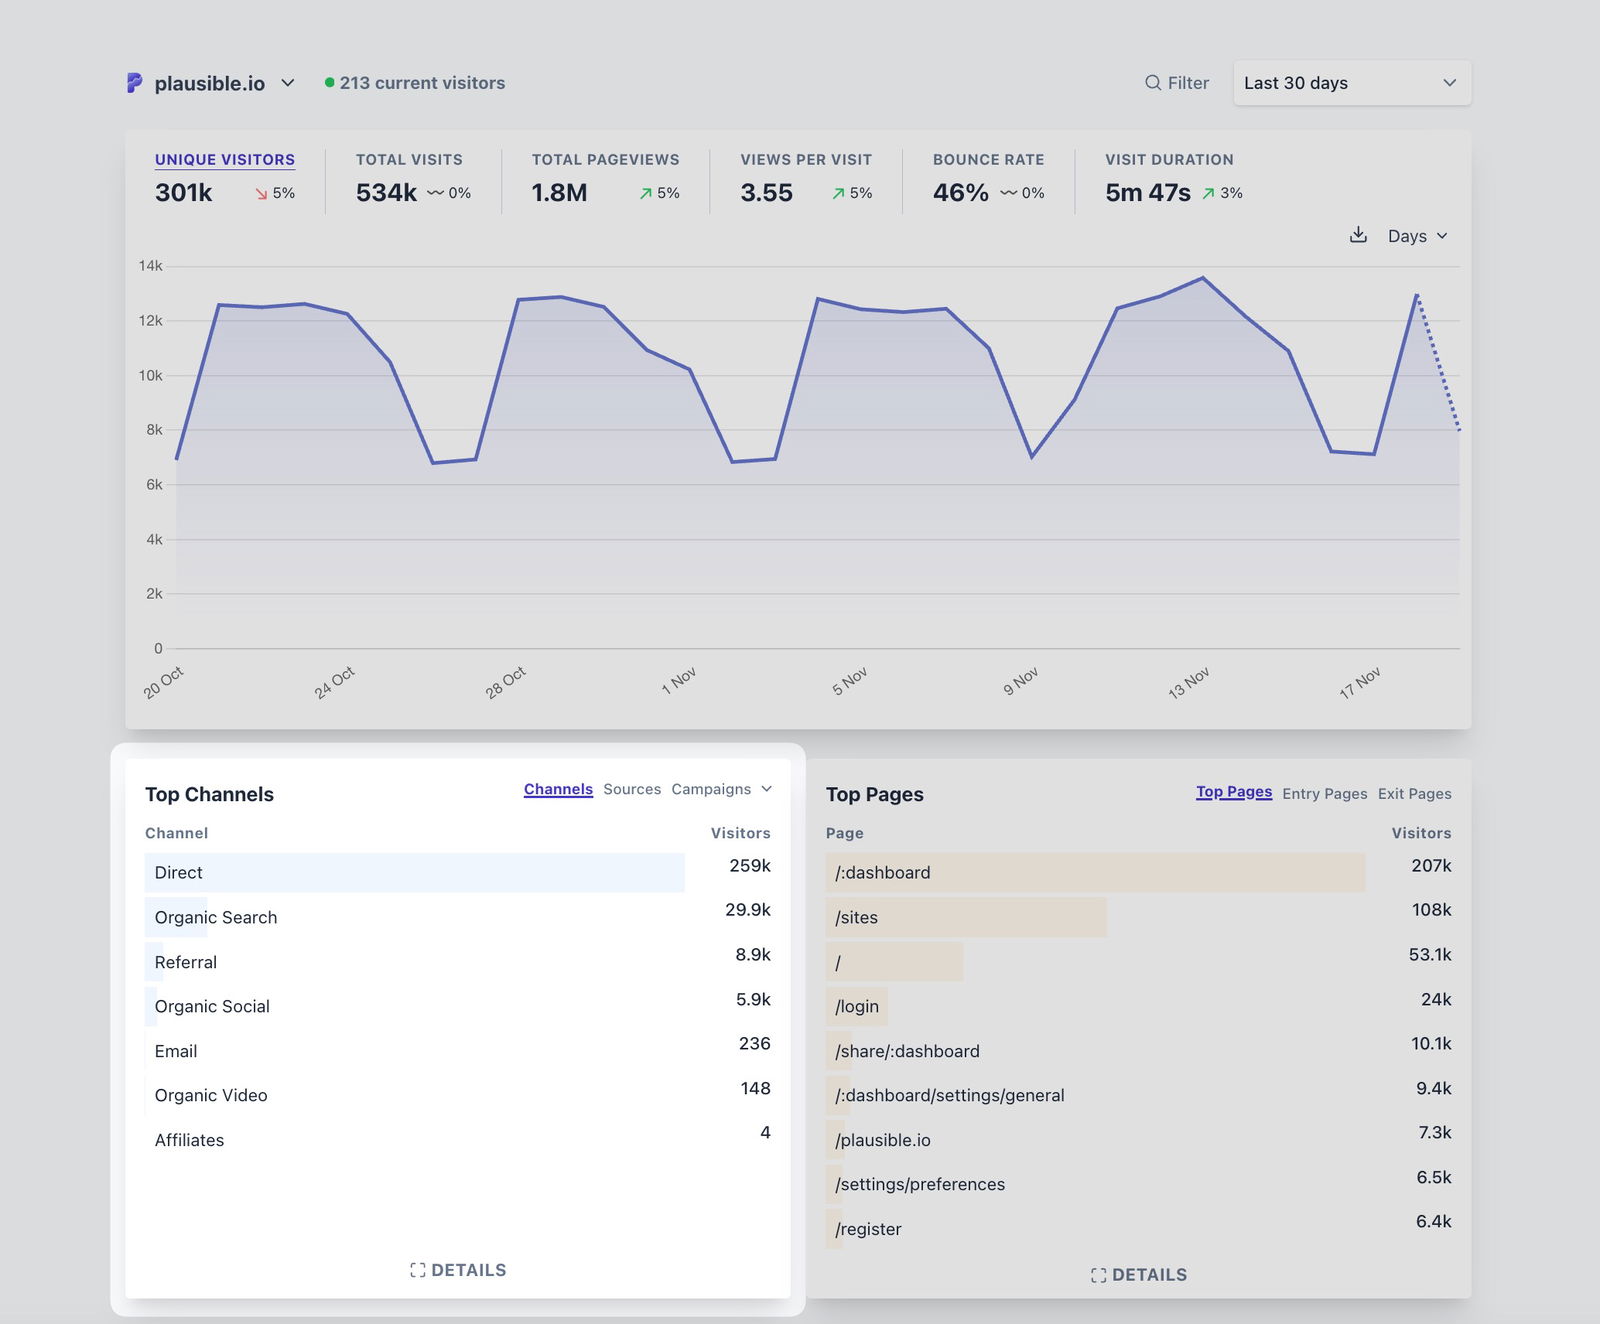
You can now find the all-new Top Channels report on your dashboard. It automatically groups your traffic into key marketing channels like Direct, Organic Search, Referral, Paid Social, and more. For a full list of channels, check out our documentation.
When you click on any channel, your dashboard will filter to show the sources under that category. For example, Organic Search will display sources like Google, DuckDuckGo, Bing, etc.
This gives you a complete view of your most effective marketing channels in one place, without the need to manually combine data from different reports. You can easily track key metrics like unique visits, engagement, bounce rates, goal conversions, etc., by channel, helping you make more targeted optimizations and focus your marketing efforts where they’ll have the greatest impact.
-
Compare all metrics over time periods
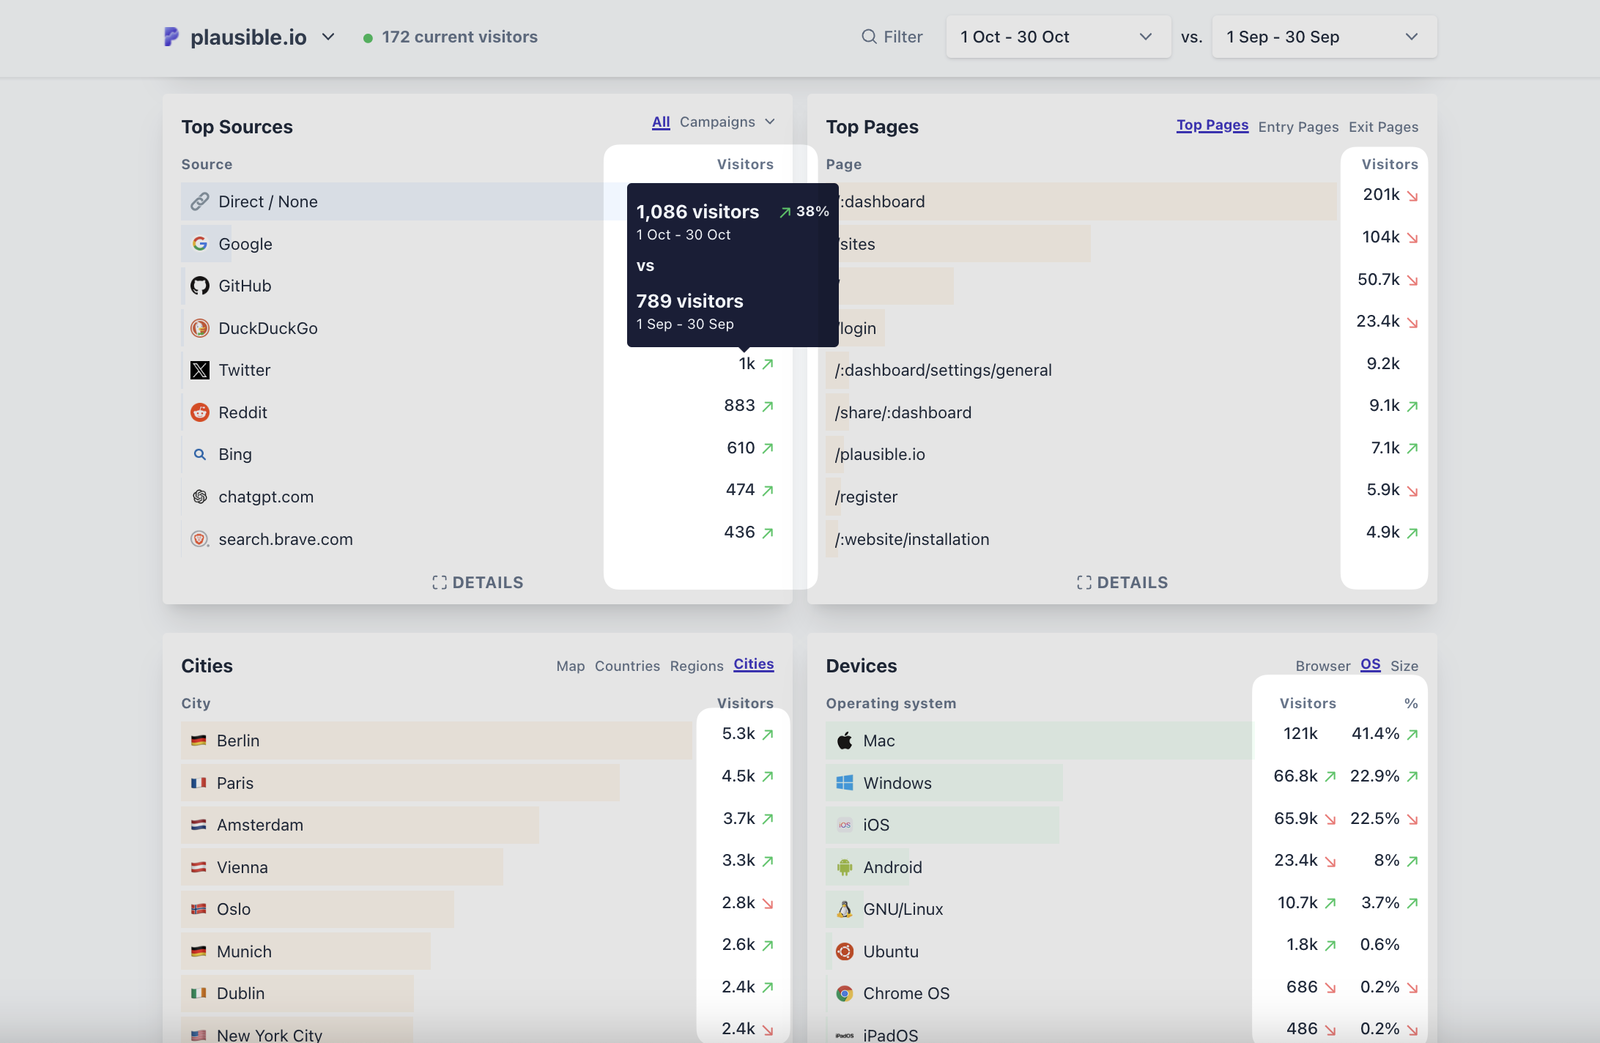
Previously, the “Compare” date ranges option allowed comparisons only for top metrics and the line graph.
Now, you can compare all dashboard metrics! Once you activate date range comparison (by clicking ‘X’ or using the time range selector), you’ll see colour-coded arrows next to each metric, indicating improvements or declines compared to the previous period.
Hover over any arrow for a detailed breakdown.
-
Stats API V2 is here
We have made significant improvements to the Stats API: a way to retrieve your stats programmatically. The new V2 offers simpler querying, more flexibility with custom metrics, filters, and time ranges, and better performance when handling complex queries and large datasets.
Quick overview of the new capabilities:
- The new API supports breakdowns by multiple dimensions (previously named properties) and time ranges.
- Interactive documentation and playground which allows testing out queries in the documentation itself.
- New dimensions `visit:country_name`, `visit:region_name` and `visit:city_name` which simplify analyzing user behavior by location.
- New API supports custom ordering of results.
-
Improved filtering –
- New structure requires less work from users to escape things.
- New regular expression matching operator.
- Complex conditions using OR/AND/NOT conditions.
- Increased limits for users on how much data is returned by a request for ease-of-use.
-
New Shopify integration for tracking e-commerce events
We have migrated from Shopify’s deprecated “Additional scripts” feature to the new “Pixels” setup. This ensures a much easier and efficient tracking of e-commerce events moving forward.
You can now effortlessly track checkout pages and customer events like site searches, adds-to-cart, started checkouts, purchases, etc. on Shopify. You can track revenue attributions as well.
Simply copy and paste our pre-built code blocks into your Shopify store. Visit our documentation to get started.
-
Remote logout
You can now log out of active sessions on other devices and browsers, enhancing account security and providing better control over your login sessions. Visit your “Account Settings” and find the “Login Management” section to manage your sessions.
-
Sort reports by performance metrics
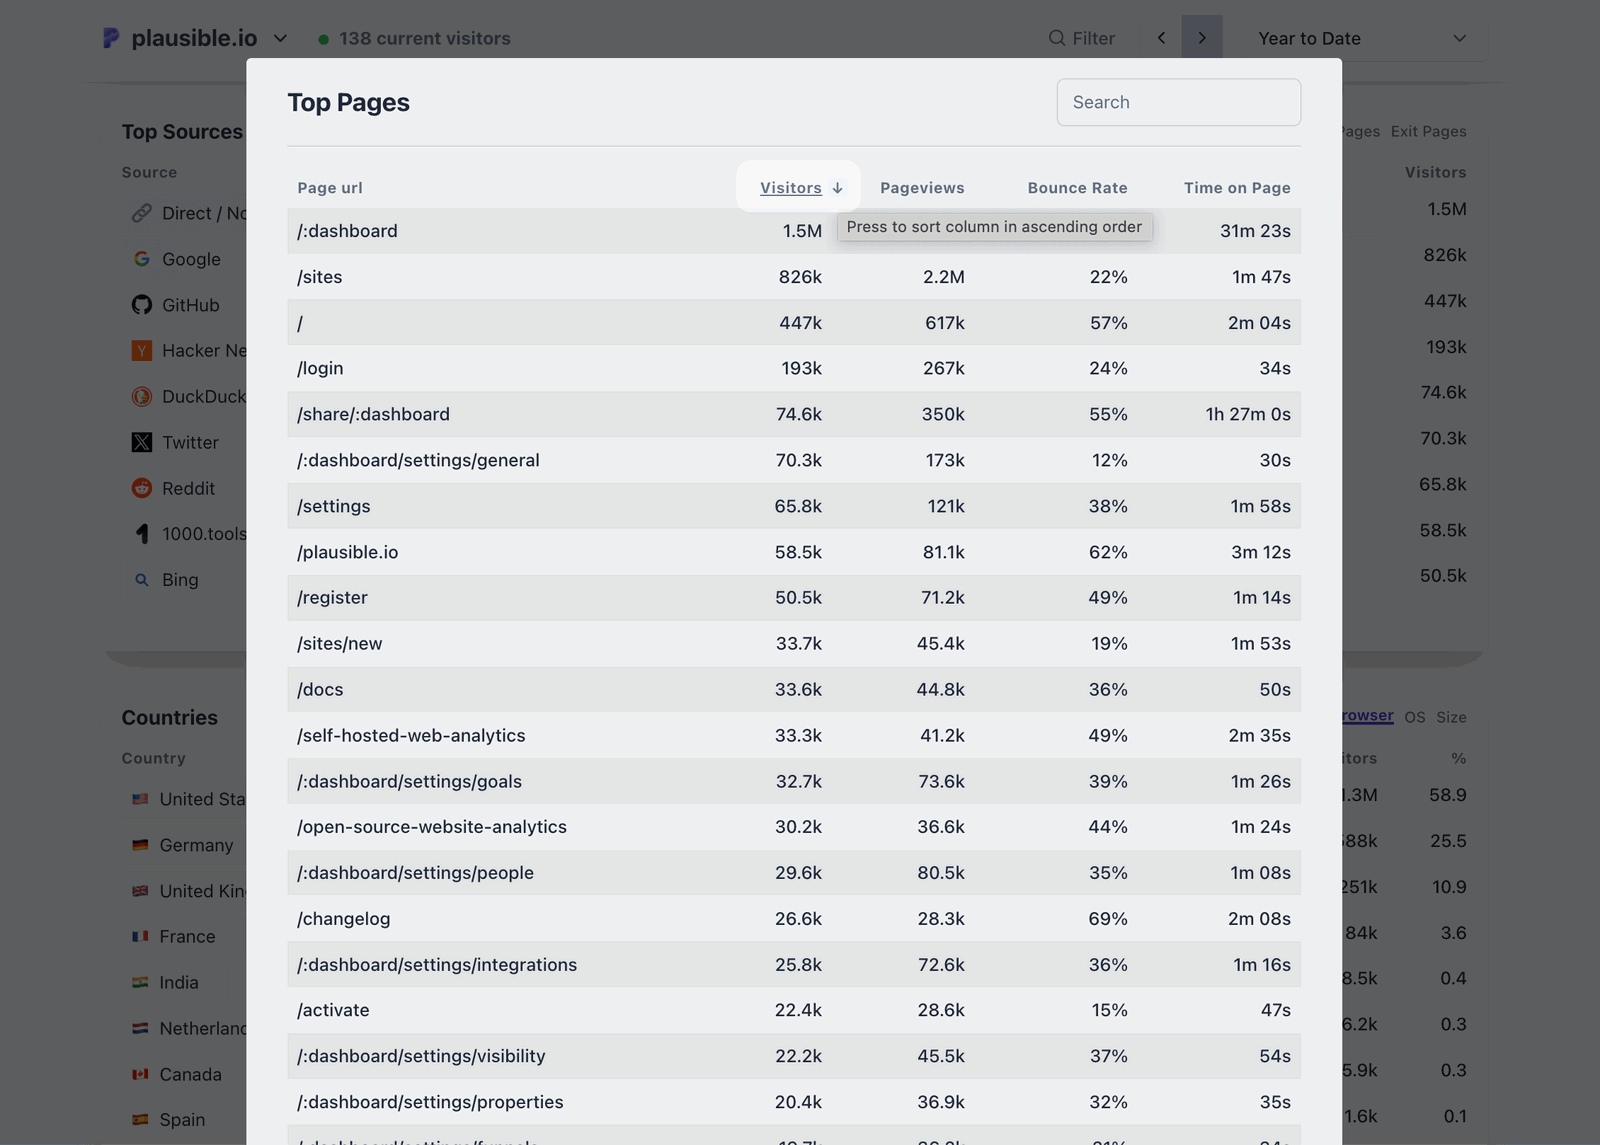
You can now sort your reports by performance metrics such as Visitors, Pageviews, Bounce Rate, and more.
Easily organize your data in ascending or descending order by clicking the “Details” option to expand the report and selecting any metric heading to sort.
-
Setup enhanced measurements effortlessly.
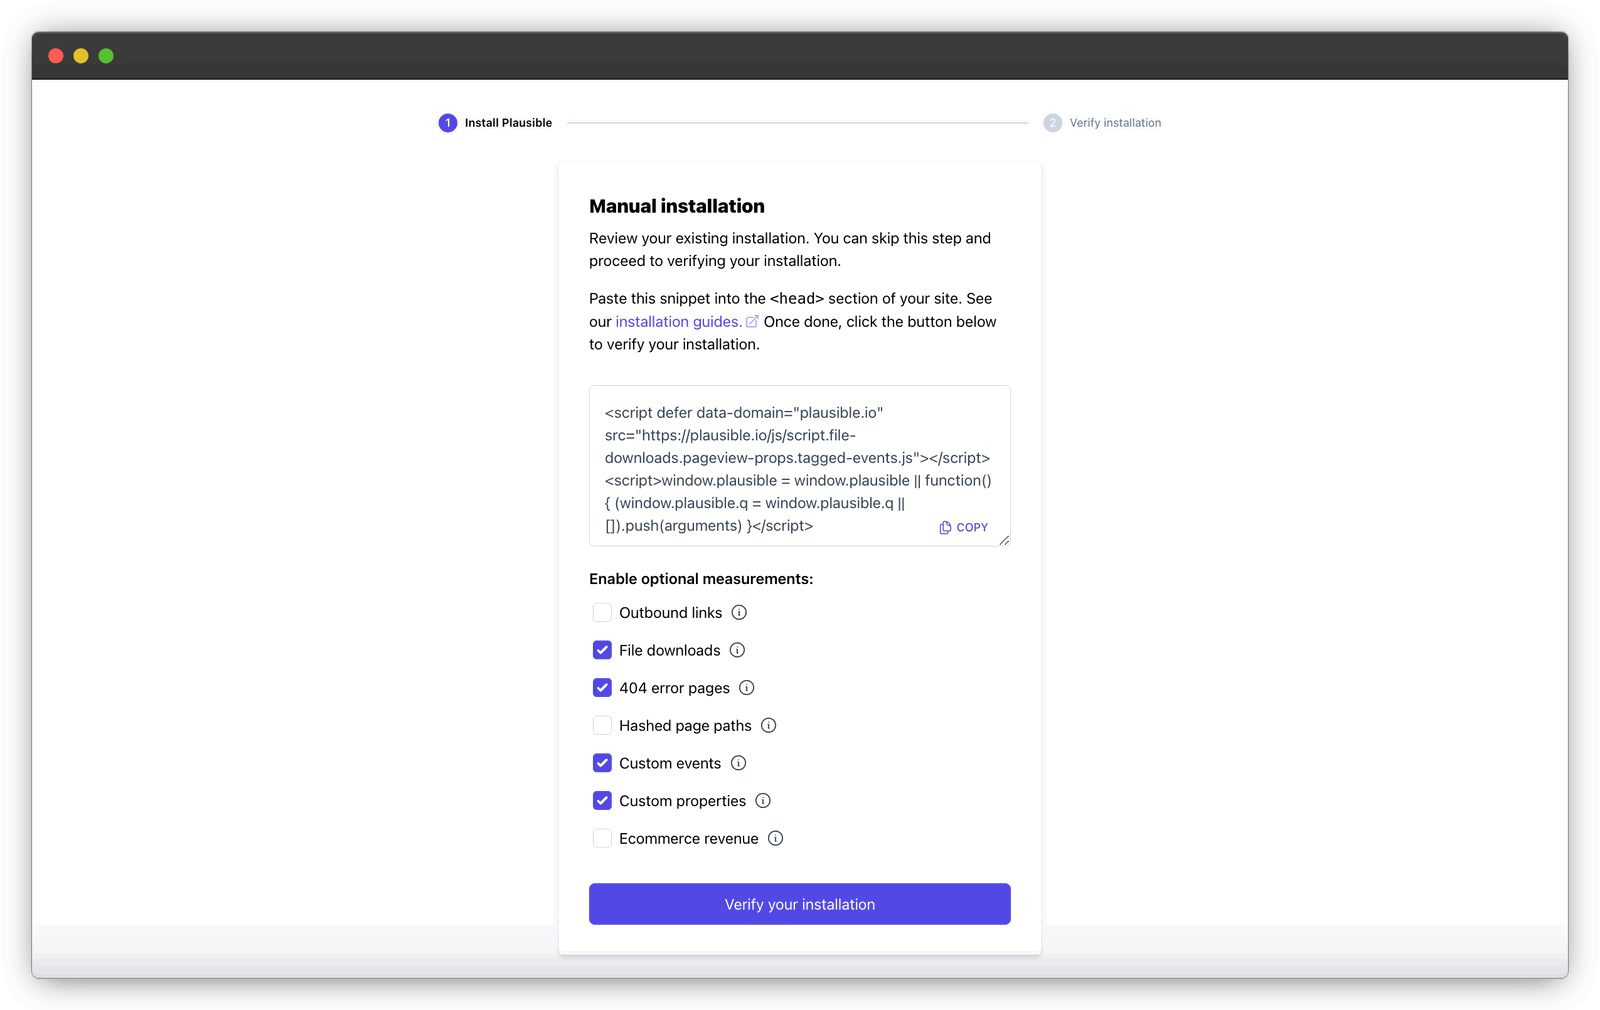
It is now easier than ever to implement enhanced measurements to your Plausible setup. During onboarding, simply choose the measurements you want using a checklist.
We’ll provide an updated code snippet, so you won’t need to handle the code yourself.
You can also update these settings anytime by clicking “Review Installation” on the General page of your “Site Settings”.
-
Edit goals, and full Browser & OS data
Editable Goals: You can now edit Pageview and Custom Event goals, including changing their settings and display names. This makes your goals more personalized and your reports and funnels more organized.
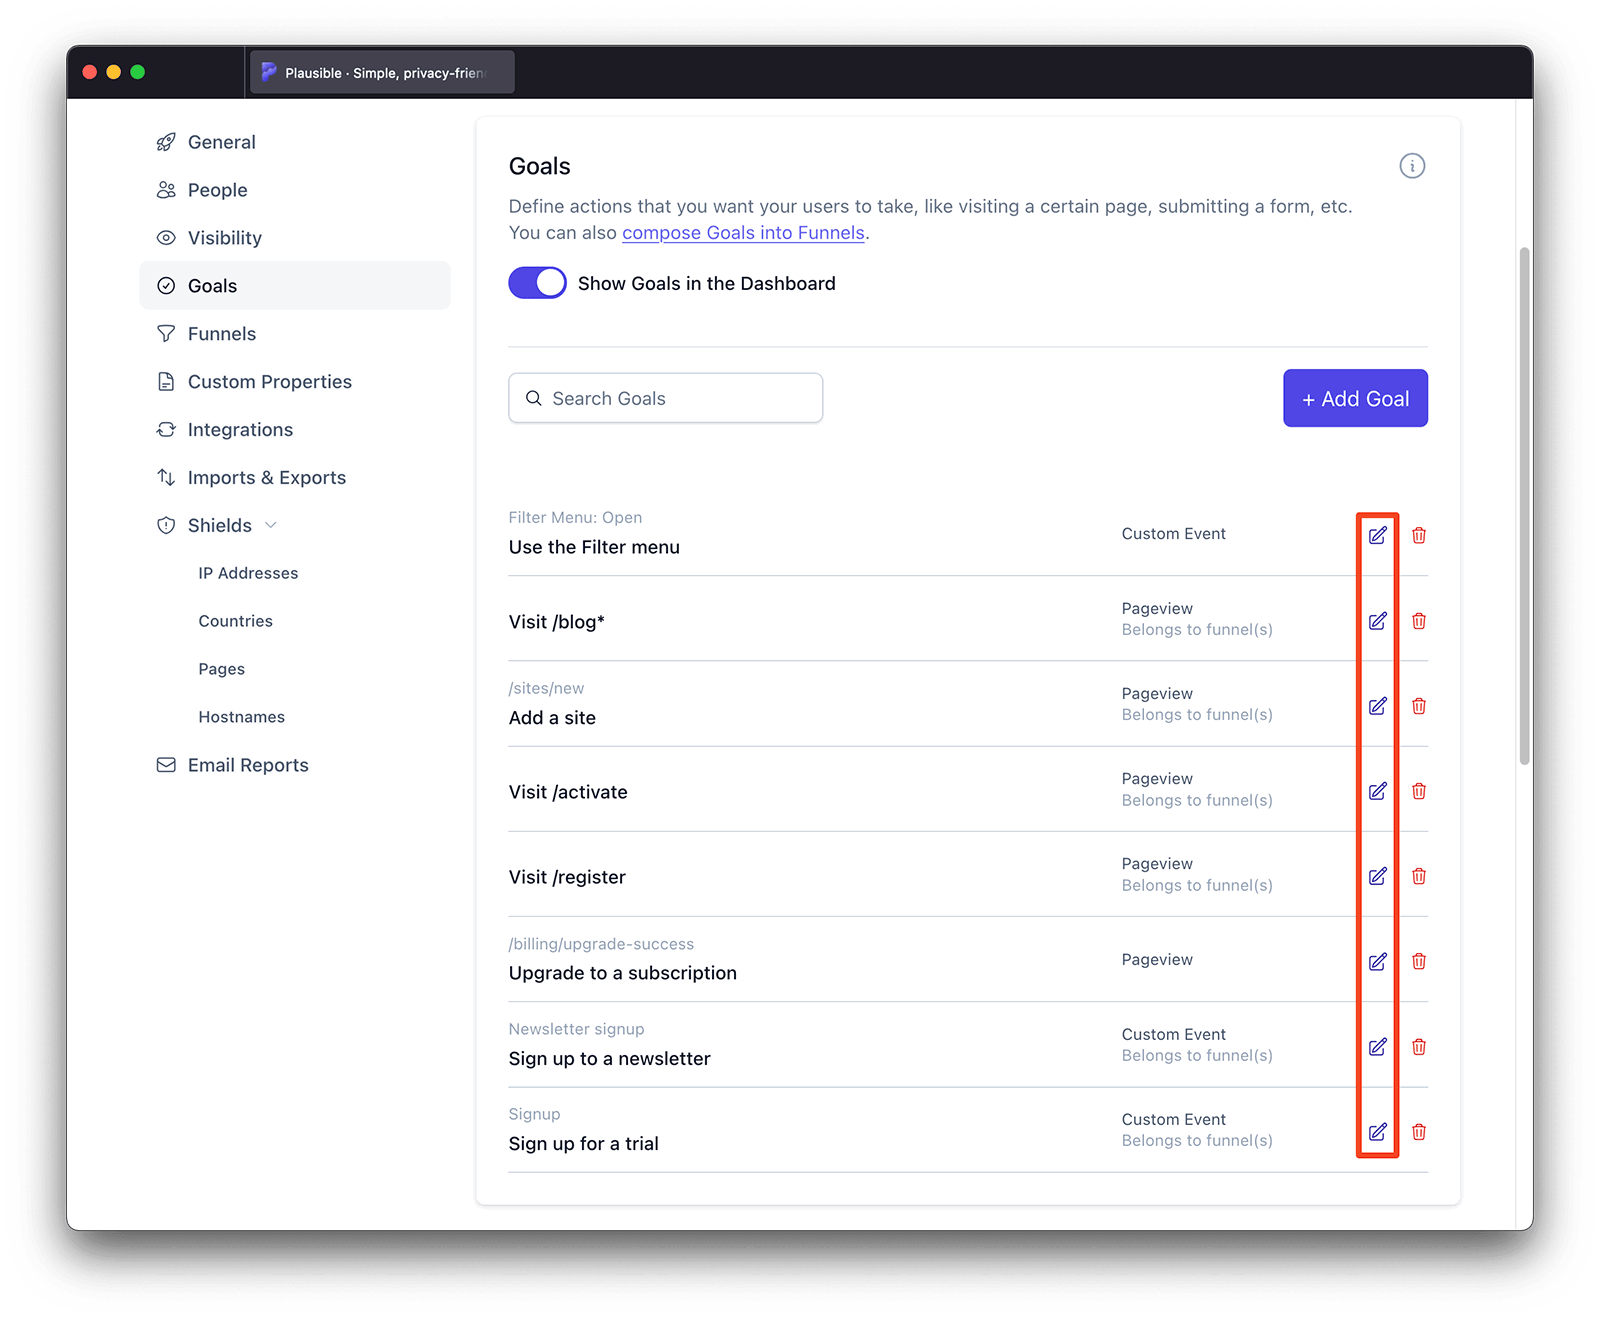
Full Browser & OS Data: We’ve also added detailed browser and OS data! Now you can see all browsers, browser versions, OS, and OS versions used by your visitors, along with metrics like bounce rate and visit duration.
-
Edit funnels
Have you set up some funnels to help you boost conversion rates? You can now edit funnel steps or rename any of your existing funnels directly from your site settings.
-
Traffic drop alerts
In addition to the traffic spike email alerts, you can now enable traffic drop alerts as well. This can be useful to notify you if your site has a technical problem, an issue with your Plausible integration or some trouble with the marketing campaigns you’re running. See more here.
-
More powerful and flexible audience segmentation
You can now segment your audience by “does not contain” in addition to “is”, “is not” and “contains”.
Explore the “Filter” menu where you can also search for anything or filter traffic by multiple entries (say multiple countries or multiple referral sources).
Note that when you view a specific audience segment, your marketing funnels are filtered to show only the activity from that segment.
-
You can now filter and export your imported data
We’ve made some improvements to the imported data from UA, GA4 and CSV:
-
Filtering imported data: You can now filter imported data directly from the dashboard and within the stats API. Please note that due to its nature, the imported data filtering capability is limited compared to our native data filtering. Details here
-
Exporting imported data: You can now export imported data using the CSV export and the stats API
-
-
A tool to help you check if Plausible has been integrated correctly
There’s now a testing tool to help you check if Plausible has been integrated correctly. It sends test traffic to your site to ensure that everything is working. And if we encounter an issue with your integration, we will provide tips on how to fix it.
You can find the testing tool both as part of the onboarding process for a new site and directly in the site settings of any site. Learn more.
-
Search Console filtering is here
You can now filter your dashboard by page, country or device and see the keyword terms for that segment of your audience. We now also display impressions, CTR and position for each search term.
Haven’t connected your Search Console to Plausible yet? See how to do it here.
-
Import GA4 custom events (and add all existing events with a single click)
Our GA4 import functionality now imports your custom events data as well. If you’ve previously imported the GA4 property and now wish to include your custom events, please delete the previous import and do a new import. Details here.
We’ve also improved the process of adding custom events as goals in your site settings. You no longer need to manually add events one at a time and can now add all existing events with a single click. More here.

-
CSV export and import
We’ve improved our CSV export functionality. You can still export any segment of your audience directly from the dashboard but now you can also perform a full export from the site settings without any limits on the number of entries. See more here.
And you can now also import external data using CSV files. The CSV import supports Plausible data by default but can also be used to import data from other sources if the external data is formatted according to our guidelines. See the full details.
Note that our Google Analytics importer is still the recommended option when looking to import the data from UA and GA4. And if you’re looking to transfer a site from one Plausible account to another, the transfer ownership functionality is the recommended way.
-
Import GA4 stats
It’s now possible to import both UA and GA4 properties into the same Plausible dashboard. We’ll automatically detect time ranges to prevent double counting of periods and to avoid any gaps in the data. You can learn how our Google Analytics import works here.
-
Filter stats by subdomain and block traffic from unwanted hostnames
You can now filter your stats by hostname. This allows you to view a global overview of traffic across all hostnames as well as segment traffic by individual subdomains all in the same Plausible dashboard.
It’s possible to apply a hostname filter both by using the filter button in the dashboard and through the stats API.
Learn more about hostname filtering.
Do you see some unwanted hostnames in your list? You can validate the origin of your traffic and block all unwanted hostnames. This feature is in addition to being able to block traffic by IP address, country and page. See how to block specific origins of traffic.
-
Display total conversions and conversion rate over time
You can now click on the “Conversion Rate” and the “Total Conversions” metrics in the top graph to view the trend over time.
These metrics have now also been added to the “visitors.csv” file in the CSV export. And “conversion_rate” is now also available in the stats API.
-
See percentage of visitors using VPNs (and block traffic from particular countries)
We’ve improved the accuracy of the “Locations” report. Visitors that use VPN services are now grouped under the “Anonymous VPN Service” entry in the Countries tab. This eliminates noise that VPNs add to locations and makes it easy to view the percentage of your visitors using VPNs.
On a related note, it’s now possible to block traffic from particular countries from being recorded in your dashboard. This is a more permanent option compared to our filtering which allows you to temporarily exclude traffic from some countries when doing reporting. See more here.
P.S. January not only marked our 5th anniversary but it was also our best month yet in terms of MRR growth! We’re celebrating these milestones with our first logo redesign in all this time.

-
Segment by multiple custom properties
Do you send custom properties alongside pageviews and custom events?
You can now segment your audience by multiple custom properties. Just keep selecting additional custom properties in your dashboard as you’re filtering.
You can use the filter button on the top right of the dashboard to do the same too. There we’ve also added the “contains” option for even more powerful segmenting.
P.S. It’s now easy to exclude your internal traffic from being counted in your stats. See how.
-
Improved bot detection
We’ve been working on improving our bot detection. We now:
- Block traffic based on the User-Agent header
- Filter out known referrer spam domains
- Block traffic originating from data centers
- Detect and exclude unnatural traffic patterns
All this is enabled for all sites out of the box so you don’t need to worry about having bots in your stats.
P.S. Today marks 5 years since we launched Plausible! Thanks to your trust and support, we’ve grown to a team of 8 and have counted more than 73 billion pageviews in a privacy-friendly way! ❤️
-
Two-Factor Authentication now available
You can now enable two-factor authentication (2FA) as an extra security layer for your Plausible account in your account settings. You can read more details here.
-
Pin your most-used sites for quick access
You can now pin sites that you want to feature at the top of your sites page. You can pin up to nine sites. The most recently pinned site will automatically appear at the top of your list, helping you organize your dashboards by how often you use them.
Your pinned sites will also show up in the site switcher list that you can see within each dashboard by clicking on the site name in the top left. You can navigate between the sites in the site switcher list using keyboard shortcuts 1 to 9.
-
"Business" subscription plan is here
Since the launch in 2019, we’ve continuously worked to improve our product and infrastructure. We now have 8 full-time team members and several paid external contributors. We don’t have any investors, so all this is solely funded by the fees our 12,038 subscribers pay us. Thank you for your trust and support! ♥️
One of our commitments has been stability in pricing. Nobody likes price hikes, so we’ve refrained from increasing the cost of Plausible subscription for our loyal subscribers so far. We plan to continue with that approach.
In light of this, we’ve just introduced our new “Business” subscription plan. The “Business” plan is designed to offer more advanced business features while helping us cover our costs.
If you want to keep access to these premium “Business” features, which currently include funnels and ecommerce revenue, you can upgrade to the new plan with the latest pricing. If you upgrade to the new plan, the amount you’ve already paid for your current subscription will be adjusted for the remaining time, ensuring you only pay the difference.
If you don’t need these additional features, you’re welcome to continue on your current plan, paying the same amount as you used to. Regardless of your plan choice, we will continue investing in our product, infrastructure and team to bring you an even better experience in the future.
On a related note, we’ve launched a new feedback section to keep you updated on Plausible’s development and to hear your input. It lets you see what’s new and what we’re working on next. You can also vote on existing ideas or suggest new ones. Check it out.
Do you have any questions or need any help? Please contact us. Thank you!
-
Improvements to the "My Sites" page
We’ve made some improvements to the “My Sites” page:
- You can now search for any of your sites
- There’s a graph for an overview of the traffic
- And a comparison to the previous period so you can see the trend
Take a look. Have fun exploring!
-
A dedicated custom properties report is now live
You can now find a dedicated tab for “Properties” within the “Goal Conversions” report of the dashboard. This tab provides a list view of all the custom properties you’re collecting, both at the custom event and the pageview levels.
To see all properties in the list, you must first explicitly add them in the “Properties” section of the site settings, similar to how it works for custom events themselves. You can add all the existing properties with a single click.
This feature also gives you the flexibility to choose which properties you want to display (or not) in the dashboard list, similar to the control you have over custom events.
-
Funnels, revenue goals and custom props for pageviews now live
We’re celebrating the end of Google’s Universal Analytics by announcing three new features:
-
Funnels: You can now follow the visitor journey from a landing page to a conversion with our multi-step funnel analysis.
-
Revenue goals: You can now assign monetary values to custom events and track marketing revenue attribution for your ecommerce store.
-
Custom props for pageviews: You can now attach custom properties to pageviews too and open up a whole new range of use cases: stats by user role, login status, language, author, category and more.
These features will become a part of our new business plans later this year. They’re free-to-use during the preview but will be exclusive to business plan subscribers after that. More details will be announced in the upcoming weeks.
-
-
Compare your stats over time
You can now compare your stats over time. Compare to the previous period, year over year or a custom period. Match by day of the week to avoid any discrepancies caused by the weekend.
You can filter your dashboard any way you wish to analyze a segment of your audience over time. You can also change the chart interval for a more granular comparison view. And if you’ve imported your historical Google Analytics stats, you can compare against those too.
Select “Compare” in the date picker or press the “X” key on your keyboard to start comparing.
Learn more about the comparisons here and have fun exploring!
-
Change your domain name in site settings
Domain name changes just got easier! 🎉
Visit your site settings and update your domain name directly. No need to reach out to us for help anymore.
The instructions are here.
P.S. We’ve got a new WordPress developer on board so we just released a new version of our plugin. It now tracks file downloads, custom events can be setup using CSS class names, you can exclude pages and user roles from being tracked and more. Details here.
-
Filter by multiple countries, pages, sources and more
You can now filter your stats by multiple countries, pages, sources and more, all at once.
This is useful to group specific geographical regions, separate organic search traffic from other sources and segment your audience to your needs.
Click on the “Filter” button in your dashboard to start exploring.
-
"Visits" and "Views per visit" are now available
You can now find two brand new metrics in your dashboard: “Total visits” (Sessions) and “Views per visit” (Pages/Session).
We’ve made several less prominent enhancements too. A more accurate cities report, a more accurate screen size report, a more mobile-friendly top graph and improvements to the speed, consistency and stability of our service. For a comprehensive overview of all the changes we make daily, check out our GitHub.
P.S. Thanks to the support of our 9,500+ subscribers, we collected $58,000 in our donation fund last year. Thank you for helping us make a bit of a difference! ❤️
-
Custom events are now simpler to set up
We’ve made our custom events simpler for sites that use CSS classes. You can now add a CSS class name to any element on your site to start tracking conversions. Details here.
Does your site use the ID attribute instead? It’s now simpler to set up custom events with ID attributes too. See an example in our Webflow instructions here.
P.S. “Direct / None” traffic is now shown in the main view of Top Sources as well. Happy holidays!
-
You can now set a different interval on the top graph
You can now set a different interval on the top graph to get a deeper level of detail and make it easier to spot trends. We will save your last selection for your next session too.
-
Support for international domain names and 24-hour time format
We’ve improved the way we handle international sites:
- Umlauts and other special characters (including numbers, dots and slashes) are supported so you can add international domain names to Plausible
- We automatically display the time format (24-hour or 12-hour am/pm) for the top graph timeline based on your browser’s defined language
- We’ve improved how we deal with international time zones and daylight saving time changes
P.S. We’ve reached $1M ARR and are counting stats on 66,000+ sites with 2 billion pageviews per month between them. We’re now a team of 8 solely funded by our 8,000+ subscribers. Thank you for your support! ❤️
-
Choose a different metric on the top graph
You can now choose a different metric to display on the top graph. You can display one metric at a time, you can also choose not to display the graph at all, and we save your last selection for your next session.
-
Google Analytics import is ready
Universal Analytics, the current version of Google Analytics, will be sunset and will stop counting stats on July 1st 2023. There’s no way to import your historical Universal Analytics stats into the new Google Analytics 4, so we’ve put a lot of effort into making a Google Analytics stats import tool ourselves.
You can now import your historical Google Analytics (Universal Analytics) stats into your Plausible dashboard. The stats are imported from your first Google Analytics visitor until your first Plausible Analytics visitor. Learn more here.
-
You can now track file downloads
In addition to the 404 error pages and external link click tracking, Plausible can now automatically track when a visitor clicks a link leading to a file. All the most common file extensions are tracked by default, but you can also specify a custom list of file types to track. Here’s how to enable file download tracking.
-
Plausible is powered by European-owned cloud infrastructure
You may have heard about the ruling by the Austrian DPA that the use of Google Analytics and other US-owned cloud services violates the GDPR as they’re “subject to surveillance by U.S. intelligence services and can be ordered to disclose data of European citizens to them”.
Plausible is incorporated, built and hosted in the EU. All site and visitor data we collect on your behalf is exclusively processed with servers and cloud infrastructure owned and operated by European companies. You can learn more here.
-
Regions and cities are now live
Happy New Year! Thanks to your support, we’ve collected $19,356 in 2021 and we’ll donate 100% of it to a handful of open source and environmental projects over the next few weeks 💚
Oh, by the way, regions and cities are now live in your Plausible dashboard!
-
UTM Term and UTM Content are now supported
In addition to the UTM Source, Medium and Campaign, you can now also count clicks and conversions from UTM Term and UTM Content. Find them all in your Top Sources report.
Not familiar with UTM tags? Learn how to use them to uncover direct/none traffic.
-
You can now download your invoices in your account settings
We automatically send email receipts after a successful payment, but you can now also find your invoices in your Plausible account settings. In the top right menu, click on your account name and choose “Settings”. To download your invoices, find the “Invoices” section.
-
You can now export all of your stats in a CSV format
Click on the download icon on the top right of your Plausible dashboard. It will export a ZIP file which includes CSV files of the individual reports. You can then import your stats into Excel or other data analysis tools.
You can even export a filtered view. Filter your dashboard by any metric to get an export of that particular view. Segment the dashboard by any goal such as external link clicks, 404 error pages or custom events to download those metrics.
-
Conversion rate for all the different metrics at a glance
When filtering by a specific goal, in addition to the overall conversion rate (CR), you can now see CR for other metrics too. This makes it easier to discover the best converting campaigns, referral sources, landing pages, articles, countries and devices at a glance.
-
Events API is now available
In addition to the stats API and the sites API, we now also have the events API. You can use it to record pageviews and custom events. This is useful when tracking mobile apps or for server side tracking. Learn more here.
-
Filtering is now more powerful
There’s now the “Add filter” button in the top right of your dashboard that makes filtering even more powerful.
It adds extra functionality so now you can search for any metric (easy way to find that specific page), exclude certain segments of traffic (see all traffic outside the US for instance) and group your pages too (analyse your blog posts separately from the rest of the site).
Click on the “Add filter” button to explore or read more here.
-
You can now track visits on localhost
You can now use the plausible.local.js extension if you want to count visitors on localhost. This is also useful in Cordova, Capacitor and other hybrid apps. Learn more here.
-
Invite team members, assign roles and transfer ownership of a site
You can now invite team members to view the stats and manage the sites you have added to your account. Learn more about users and roles.
You can now also transfer the ownership of a site to a different Plausible account. See how the site ownership transfer works.
-
A proxy to bypass adblockers
If you’re concerned about adblockers, we’ve now made it easy to serve our script through a proxy and get more accurate stats. See the instructions here.
-
Time on page is now live!
Time on page for your individual pages is now live in the Top Pages report! Have fun exploring!
-
Stats API is now out of beta
Plausible Stats API is now out of beta! It offers a way to retrieve your stats programmatically. It is a read-only interface to present historical and real-time stats. Take any metric that you want, present it wherever you want in whatever shape you want. More details in the API docs.
-
You can now embed your dashboard on another website using an iFrame
Want to showcase your stats to your visitors? Or want to integrate Plausible into your custom built client area? You can now do so by embedding the dashboard. See instructions here.
-
Get insights into the user journey with entry and exit pages
You can now find Entry Pages and Exit Pages in the “Top Pages” report. Click on the “details” button to get extra insights including visit duration for visits started on a specific entry page and exit rate percentage for individual pages.
-
Create goals for dynamic URLs without using custom events
Pageview goals are now more powerful. You can use rules to group different pages or create goals for dynamic URLs. Track all the blog posts by using
/blog**or track Woocommerce checkout pages for your ecommerce by using/checkout/order-received/*. Full details in the docs. -
Shared links are now more convenient for your clients
Our private and secure shared links have a new format which makes them easier to bookmark and access again for your clients. If password protected, the password is saved so the client doesn’t need to type it on each visit. Any existing shared link will automatically redirect to the new one.
-
Navigate the dashboard using keyboard shortcuts
You can now navigate and analyze your Plausible dashboard even faster by using keyboard shortcuts. Here are the shortcuts that we do support.
-
Exclude specific pages from being tracked
By default, Plausible tracks every page you install the snippet on. You can now manually exclude specific pages from being tracked. Here’s how.
-
Sticky header is here for easier filtering
You told us you loved the sticky header concept so it is now live! 😍 It makes it easier to:
- See the chosen time period and switch dates
- See the chosen filters and clear filters
- Get a filter drop-down menu when using many filters
- “This Month” is now “Month to Date” with a comparison to the previous period
Thanks to @Vigasaurus for helping us build this!
-
We've joined the dark side
We now have a dark theme! 🌃
We follow your system theme by default but logged in users can manually choose either system, dark or light theme in the account settings.
Thanks @nurodev for the initial theme design and @Vigasaurus for making it come alive!
-
Get traffic spike notifications via email or Slack
You can now get an email (or a Slack alert) when there’s an unusually high number of current visitors on your site 🚀
Thanks to the Changelog team for suggesting this and helping us build it 🙌
Here’s how to enable it for your site and how to set up Slack alerts too.