What are custom dimensions in Google Analytics and how to use them?
Web analytics tools like Google Analytics or Plausible provide basic information, but they can’t automatically track everything you need. Custom dimensions allow you to capture specific data that goes beyond standard metrics.
Marketers usually spend a lot of time with website performance reports, which help you see how well your marketing, communications, and other business activities are working.
Ensuring that your analytics setup is spot on and aligns with business growth and goals becomes increasingly important over time. Custom dimensions (which are nothing but custom entries in your reports) help with this by letting you track additional details relevant to you.
In a nutshell, custom dimensions bridge the gap between the data that a standard website performance report offers and what you would like to specifically know about your website.
The more robust you want your website performance report to be, the more customized it usually needs to be. Let’s see.
- What are custom dimensions in Google Analytics?
- How to use custom dimensions?
- Setting up custom dimensions in Google Analytics 4
- Custom Properties: Plausible’s simpler and effective version of custom dimensions
- Our two cents on which tool to use
- Parting tips
What are custom dimensions in Google Analytics?
Custom dimensions is a term coined by Google Analytics. As the term suggests, custom dimensions are different sorts of features/facts/attributes, i.e. additional context, about the data you collect about the events happening on your website.
Some attributes are standard and are automatically collected by the web analytics tool you use. Such examples are page URL, page referrer, link text, engagement time, etc.
While other attributes are not automatically tracked, and need to be configured by you and are hence “custom” to your use case. To understand this well, let’s understand a few related terms first:
Events
Everything in web analytics revolves around “events.” Think of an event like any sort of activity done by a visitor on your website.
Did a visitor just load a page or start a session? Did they click a link, engage with your blog post, or download a file? Or maybe they signed up, or made a purchase. Anything that can happen on your website can also have its own “event” to be tracked in a web analytics tool.
Metrics
If dimensions – whether standard or custom – are descriptive facts about events, then metrics are the quantitative measurements of the performance of such dimensions.
Some examples are event-count, conversions, engagement rate, open rate, revenue per customer, conversion rate, time on page, etc.
The relationship between events, dimensions, and metrics
A dimension is an attribute about something tracked on your website. In Google Analytics 4, custom dimensions are categorized as three types:
- Event-scoped: Attributes about events happening on your site.
- Item-scoped: Attributes about products (like product ID, color, name, quantity, price, etc.), useful if you are running an e-commerce store.
- User-scoped: Tracking attributes about your visitors or users.
We will keep the scope of this article mostly to event-scoped dimensions.
Let’s say a website event you track is “file downloads”, the following can be dimensions/attributes you might want to track about this event:
- File extension (like PDF, docx, pptx, etc.)
- File name
- Link classes
- Link ID
- Link text
- Link URL
And metrics? When you eventually see reports in your web analytics dashboard, you can see such attributes as particulars/values of those attributes and judge their performance with the help of associated metrics data available.
A stupidly simple analogy
My personal favorite way to never forget something technical is to visualize in it a regular life setting. In this case, the analogy would be this: Imagine your life was analogous to your website and it had a tracking device.
You could define certain general events to be tracked. Like “waking up”. Then, the descriptive data to be collected about the “waking up” event could be “time-of-sleep”, “quality-of-sleep”, “length-of-sleep”, etc.
And when you view a report about your waking up patterns in the past 3 months, these facts would be presented as custom dimensions and the metrics would be sleep frequency, average length of sleep, sleep rate, etc.
How to use custom dimensions?
Understanding how to effectively use custom dimensions has two parts to it: planning your analytics, and setting them up in GA4.
Plan your analytics
The general purpose of analytic reporting is to recognize patterns and understand one’s strong and weak areas for improvement. However, the exercise is more fruitful if you have goals and objectives to map your metrics against.
To avoid tracking random events and dimensions, map your custom dimensions to your website’s objectives. This will also keep your reports cleaner and useful.
Website objectives vary based on the nature of the business. For instance, a SaaS tool’s website might aim to generate free trials, a news or media website’s focus could be increasing content engagement, while an e-commerce site may prioritize getting orders.
If you’re unsure about your website’s objectives, start by asking core business questions about your long-term and short-term goals. This will help derive clear website objectives.
If you’re in the early stages and still figuring out your business or marketing objectives, the goal for setting custom dimensions would in fact be to experiment and find what works best for you. In that case, be sure to update your analytics setup as you gain more clarity over time.
Based on your website’s objectives, you can enlist the relevant actions you want your users to take to help the objectives. For eg., if your goal is to increase content engagement, key actions can be visiting the blog page, or signing up for a newsletter. These can become custom events to be tracked.
Next, determine what additional context (custom dimensions) you’d like to track about these events. For eg. For the event capturing visits to the blog page, you can track attributes like author, content format, content group, topic, time on page, word-count of articles, etc.
Later, when you see your reports, you can learn stuff like which author or content topic drives the most number of clicks (a metric), or if word-count is a deciding factor in the articles that receive most clicks.
Other tips:
- You will most likely have more than one objective. And different teams have different KPIs. It is alright to track these together from a single dashboard, as long as different teams have clarity on what is their core metric to be looked at.
- For a complete visualization of how visitors interact with your website, try incorporating your events and goals into funnels.
- Regularly review and adjust your events and custom dimensions as and when you notice any changes in your goals or user behavior. This could happen monthly, half-yearly, or yearly, depending on the stage of the volatility of growth.
Setting up custom dimensions in Google Analytics 4
Custom dimensions in Google Analytics 4 (GA4) let you attach extra, custom-defined context (attributes) to your events, users, or items: beyond what GA4 tracks by default.
- Setting events Firstly, you need to determine with the help of GA’s documentation which events are not being tracked automatically or with the help of GA’s Enhanced Conversions set of events. If the event you want to track is not a part of either of those categories, then see if it’s a “Recommended event.” If yes, then many cases require you to follow Google’s naming convention to set these events for yourself. And if it is not a “Recommended event”, then create a custom event. Later, you can mark some events as “Key events” within your GA4 dashboard. Key events is GA4’s new name for what was earlier called “conversions.”
- Parameters Parameters are like a precursor to custom dimensions. They tell the script what additional context to gather about an event. You need to set up textual parameters (so they can be converted to custom dimensions) and numerical parameters (so they can be converted to custom metrics). So they are pretty much like custom dimensions and custom metrics, but not quite. They only gather additional data about events in the backend, but can’t be directly used in reports. Plus: You need to make sure that you don’t create custom dimensions before seeing if there is already a predefined dimension or metric. And do check the limits on creating the number of custom dimensions and metrics of each type. P.S. In all cases of creating custom events or parameters, you would require some additional Google Tag Manager and DebugView skills as well.
-
Custom dimensions and metrics Once your backend setup is complete, open your GA4 dashboard, ensure if data is being collected correctly using the DebugView. Then proceed to add custom dimensions and metrics to be displayed on your reports.
In the GA4 interface: go to Admin → Custom definitions → Create custom dimension.
- Choose a Dimension name (the display name you want to see in reports.)
- Select the correct Scope (Event, User, or Item) depending on how you sent the data.
- For Event parameter / User property / Item property, enter the exact name of the parameter/property as sent in your tracking setup. Even if it doesn’t show in autocomplete, you can type it manually.
- Optionally, add a Description, helpful for documentation and future reference.
For this, you can name the custom dimension or metrics something different from the parameters collecting the respective data, while adding additional information like unit of measurement, scope, and description.
- Reports While creating your free form or funnel exploration reports, remember to ensure configuring relevant dimensions and metrics therein.
After setup, new custom dimensions typically appear in GA4 reports within ~24–48 hours.
Note: GA4 will not retroactively apply custom dimensions to past data; only events sent after registration will carry the new dimension in standard reports.
Where you can use custom dimensions in GA4 reports?
Once registered and collecting data, custom dimensions become available in:
- Explorations (Free-form, Funnel, etc.): go to Explore → +Dimensions → Custom, then Import and add to your report.
- Segments, filters, breakdowns, and audiences: you can use custom dimensions for deeper analysis, segmentation, or condition-based audiences.
Best practices & limitations to keep in mind
- GA4 standard quota per property: up to 50 event-scoped, 25 user-scoped, and 10 item-scoped custom dimensions (for standard property).
- Once created, you cannot change a custom dimension’s scope or its parameter name: only its display name or description. If you need a different setup, you must archive and recreate.
- Use consistent naming and keep cardinality low (i.e. avoid high-cardinality values like raw user IDs) to keep reports performant and compliant with Generally Accepted Analytics practices.
Custom Properties: Plausible’s simpler and effective version of custom dimensions
We are Plausible Analytics, the no-fuss alternative to GA4Custom Properties is our version of custom dimensions.
We take special care in keeping your analytics setup and your dashboard confusion-free. Adding custom data to your pageviews or events is far more user-friendly than the setup required by GA4.
How custom properties work in Plausible?
To set up custom properties (same thing as custom dimensions in GA4) in your Plausible account, all you need to do is two things:
- Set some custom events/goals. There are two ways to track any event in Plausible: track pageviews (doesn’t require code editing), or track custom events (requires code editing). Secondly, add these custom events as goals to your Plausible dashboard easily. So there’s no distinction/confusion between custom events and custom goals.
- Mark which properties you want tracked. Once you know which custom event-goals you are tracking, simply edit the JS snippet to let it know which properties to track as well.
Then, you will be able to add all the properties that your JS snippet is sending to your dashboard in one click. Once this is set up, you will be able to filter and segment your traffic based on properties on your dashboard, among other things. Full info here.
Because of this simplicity, you avoid the complexity of scopes (event/user/item), quotas, historical data limitations, or dashboards filled with dozens of dimension-setup screens, you just send extra data when needed.
Once data is collected, segmentation/filtering is built-in
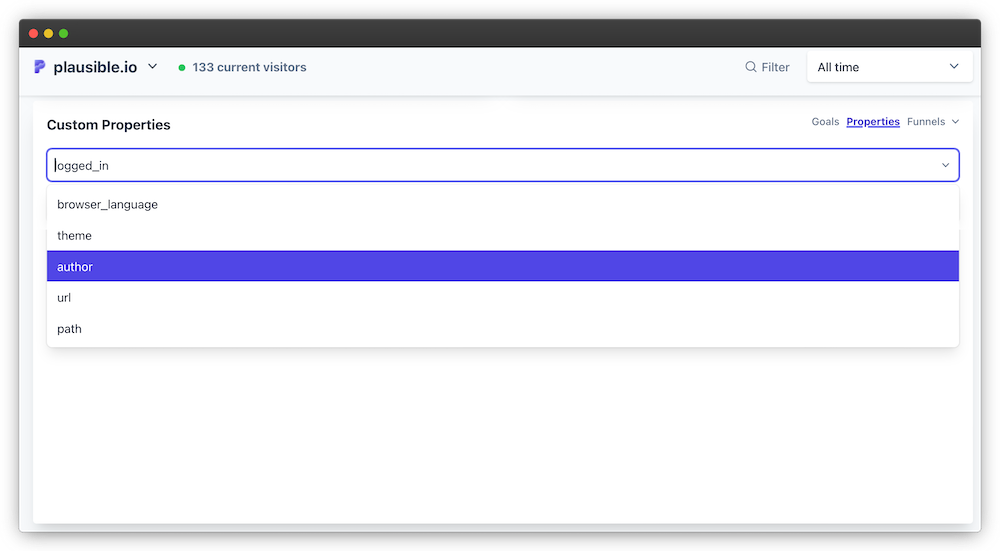
After Plausible receives these custom properties, you can easily filter or segment your traffic in the dashboard by them. Once at least one event or pageview includes a given custom property, that property becomes available under the “Properties” section in your stats dashboard.
That means you can, for example, see how different authors perform, track which content types have better conversions, or break down user behavior by custom labels — all without complicated config.
The best way to visualize and play around with custom properties is through our own publicly live dashboard.

Our two cents on which tool to use
Google Analytics 4 requires a learning curve, complex setup, and access to engineering know-how. You also need to do additional work in setting up some basic features for yourself. But the level of customization and robustness you get for yourself would be useful if you are a big agency or an enterprise.
On the other hand, Plausible takes responsibility for creating features that are user-friendly and we don’t put the ball in your court to figure out a bit too much about your web analytic reports.
All in all, Google Analytics 4 might be an overkill for you if you are a startup.
Parting tips
- Next time you open your reports, decide on a specific purpose (no matter how small) to see them beforehand. This will reduce randomness from your analytic-viewing time and give you an anchor to make better decisions.
- Even if you have less data, or missing data points, it is alright. Try looking for patterns instead.
- If something can be achieved without customization in the tool of your choice, choose the former approach. It’ll keep your setup much more clean and manageable in the long run.