Using website analytics for ecommerce revenue attribution and boosting sales
An e-commerce website has various ways of earning sales. Customers can find you through your ads, email campaigns, social campaigns, SEO, directly visiting your website and more. The process of understanding which channels are the most effective for your e-commerce store to generate sales is known as ecommerce revenue attribution.
- What is ecommerce revenue attribution in website analytics?
- How to track revenue attributions in web analytics?
- How to boost ecommerce sales using revenue attribution data?
- Concluding
What is ecommerce revenue attribution in website analytics?
Website analytics help get a birds eye view of the marketing channels, marketing campaigns, website assets, and/or any touchpoints in the buyer’s journey that contribute to a sale on your online store.
And you can learn a few things about your users too. For eg. which locations or types of devices, OS, and browsers see more sales.
Overall, you can answer some main questions like which of, and how, your products get sold the most or the least. And some other pressing questions like what is in wishlists but not getting sold, what is being searched for, which products are being viewed, how many people are abandoning carts, and so on.
Based on such data, you can optimize your budgets, copy, website and marketing campaigns for improving sales.
Revenue Attribution models
Since a customer’s journey leading up to a purchase can be lengthy and random, spanning across different touchpoints and days, it can be tricky to credit only one touchpoint for the eventual sale.
Hence, there are various types of revenue attribution models used by different web analytic tools:
Single-touch attribution models
Last-touch attribution: Fully credits the last touchpoint in a buyer’s journey. For eg. Directly visiting the product page to purchase it.
First-touch attribution: Fully credits the first marketing touchpoint in a buyer’s journey. For eg. Seeing your ad on Instagram.
Multi-touch attribution models
Time-decay attribution: Gives more credit to touchpoints closer to the time of purchase.
Linear attribution: Distributes credit evenly across all touchpoints.
U-shaped / Position-based attribution: Usually assigns 40% credit each to the first and last touchpoint, and assigns the remaining 20% evenly across the touchpoints appearing in the middle of the journey.
Data-driven attribution: Is the most flexible one that takes more factors into account, and uses algorithms to determine how to credit different customer touchpoints.
Google Analytics 4 has deprecated most of these models and currently (as of mid-2024) has two active models: the last-touch and data-driven attribution models. Plausible, being a privacy-first tool, has only a last-touch attribution model. Different web analytic tools may use a combination of different models.
Let’s get into it. ⬇️
How to track revenue attributions in web analytics?
Everything in web analytics revolves around events. Any insight you want to learn about your ecommerce site, like which product is getting sold, what is in wishlists, what is in carts, what is being searched for, how many refund requests you get, which promo codes are applied the most, etc, can be converted into an event, and related custom dimensions.
And any event that brings in revenue to you –– which mostly happens to be the sale of a product –– can be assigned a dynamic monetary value in any currency. This can be done in pretty much any web analytics tool.
This, when mapped against other data from your reports –– like associated traffic sources, top performing pages, engaging elements of the website, types of devices used, etc. –– helps you understand the correlations between these marketing activities and sales. The ideal goal is to recognize which factors significantly affect the sales.
For eg. If you sell hoodies on your ecommerce store, you could set “purchase_hoodie” as an event and enable revenue tracking for it. So whenever a customer buys this hoodie, your web analytic tool will record it as an event and assign it its revenue-value.
To visualize such conversion reports, there are various methods.
Tracking revenue-synced conversions in Google Analytics 4
Depending on the attribution model and types of reports in GA4, you can learn different types of things about different types of methods of revenue acquisitions. Here’s a simplified overview of the same:
Through Traffic Acquisition reports
The Traffic Acquisition reports in Google Analytics are session-based. They tell which channels (direct, organic search, email, social, organic shopping, etc.) you acquire new sessions from, regardless of whether the user is new or returning.
Therefore, this report uses a non-direct last-touch attribution model, i.e. it answers the question that where was such a session acquired from, wherein a conversion happened?
P.S. “Non-direct” here means that direct sources of traffic are never considered for attributing a traffic acquisition source.
Through User Acquisition reports
The User Acquisition reports in Google Analytics have user-scoped custom dimensions. This means that once GA’s tracking code identifies a user through one of these methods, it remembers them for some days, and tracks how that user is interacting with the website every time they visit.
This helps you draw a full picture of user journeys, from the point of acquisition to the point of conversion. This is why this report inherently uses a first-touch attribution model.
Through Advertising reports
If you run ad campaigns, then Advertising reports will be useful to understand buyer acquisitions too. They use both data-driven and last-touch attribution models.
Through other reports
Other than the situations mentioned above, there are two more flexible ways of reporting in Google Analytics that will help you see different channels of buyer acquisition:
- If you filter any report by dimensions like UTM source, medium, campaign, etc. and not by “session…” or “first user…” types of dimensions.
- If you make Exploration reports.
To determine which of the two available attribution models in GA4 you’d want these types of reports to use –– data-driven or last-touch –– you’ll need to configure your Attribution settings from the Admin panel. These settings would not affect the three standard types of reporting described above.
Downsides of using the data-driven attribution model
It is extremely important to acknowledge that the data-driven attribution model has some major downsides. It seems lucrative at first, because it takes away the pain of determining the best attribution models to use for your use case and leaves this job with machine learning.
Google Analytics’ AI and ML proactively study all the customer journey paths and different user actions in the background. They notice patterns and calculate conversion probabilities for different user paths. Based on this, it assigns different weightages to various marketing touchpoints leading up to a purchase.
However, you are almost always guaranteed to get half-baked and inaccurate data due to the following reasons:
- Various privacy regulations, especially from the European Union and the USA, require GA users to ask for website visitors’ consent before collecting and processing their data. Naturally, many visitors decline such requests, while your website experience gets downgraded for everyone.
- Many privacy-first systems like Apple prevent user tracking by default. This means a huge loss of data.
- A wide variety of users use Ad blockers these days, which prevents a Google Analytics script from loading at all.
- These attribution models depend on first-party cookies that expire, or can easily be deleted by a user. And any model remotely depending on third-party cookies is bound to die within this year.
- The sheer randomness of user behaviors makes it just not possible to track every single touchpoint. For eg. You cannot really ever know if a buyer came to you because of seeing a billboard, from word-of-mouth, or if they switched browsers and devices while interacting with your site a dozen times. So even meticulously built reports can mislead you, rendering the whole process worthless.
- This model keeps you in the dark because you have no idea what exactly is happening in the background, and have no control over it.
That leaves a single logical choice for tracking accurate revenue attributions: the last-touch model; with a tool that is privacy-compliant and doesn’t use cookies either. Here’s how we do it with Plausible. ⬇️
Tracking revenue-synced conversions in Plausible
In Plausible, website traffic is tracked based on sessions, and we don’t remember a user beyond one day. You get a simple dashboard, without hidden layers of menus and without having to figure out different attribution models.
Plus:
- You can get simple and quick answers at a glance.
- You don’t need to employ any consent banners on your website. This is because we are built in the EU, and are privacy-first and open-source by principle.
- You don’t have to worry about cookies-related issues because we use a cookie-less mechanism to track website data.
- You can also count data from the users who use ad blockers, by using a proxy.
You can simply filter your traffic by a revenue-marked goal, and see an overview of the sources (channels + campaigns) that brought in those sessions, the pages that received those sessions, and the devices, browsers, operating systems on which the sessions were conducted, and even get a breakdown of the revenue by exact, specific traffic sources, top/entry/exit pages, locations, browser/OS/device types, and custom properties.
P.S. If you have an e-commerce store powered by WooCommerce, you should check out our plugin for implementing a full e-commerce tracking setup in literally one-click.
Assume a situation where you have an ecommerce store on Shopify that sells hoodies and beanies. For marketing, you run Google ads, post daily on Instagram, and have some referral links from other domains. This is how you can understand which channels, campaigns, and other factors work best for your sales:
Start by setting up some event-goals, including revenue-marked purchase goals. In this case, your event-goals can be “complete purchase” (a revenue-marked goal), “start checkout”, “remove from cart”, “add to cart”, “add to wishlist”, etc. Along with such events, you can send some custom properties like product category, product name, product color, product size, etc.
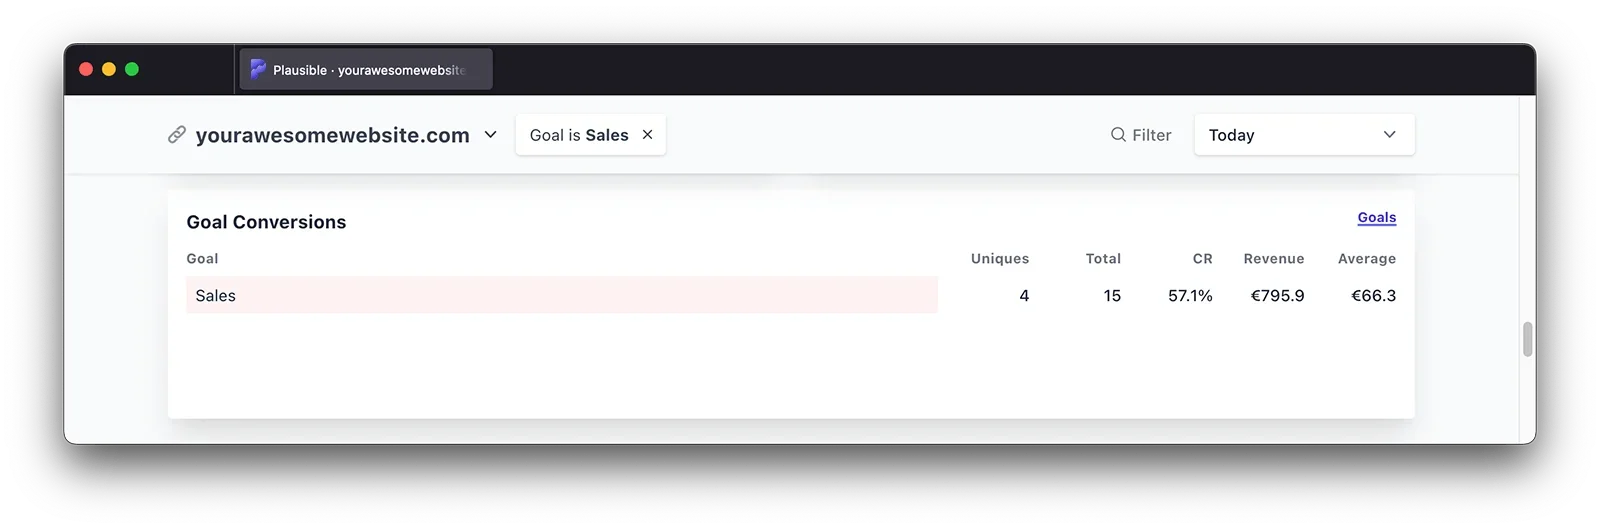
Once everything is set up and you have started receiving data, use your dashboard to simply filter your traffic by such goals and/or properties in the dashboard. Here is an example:
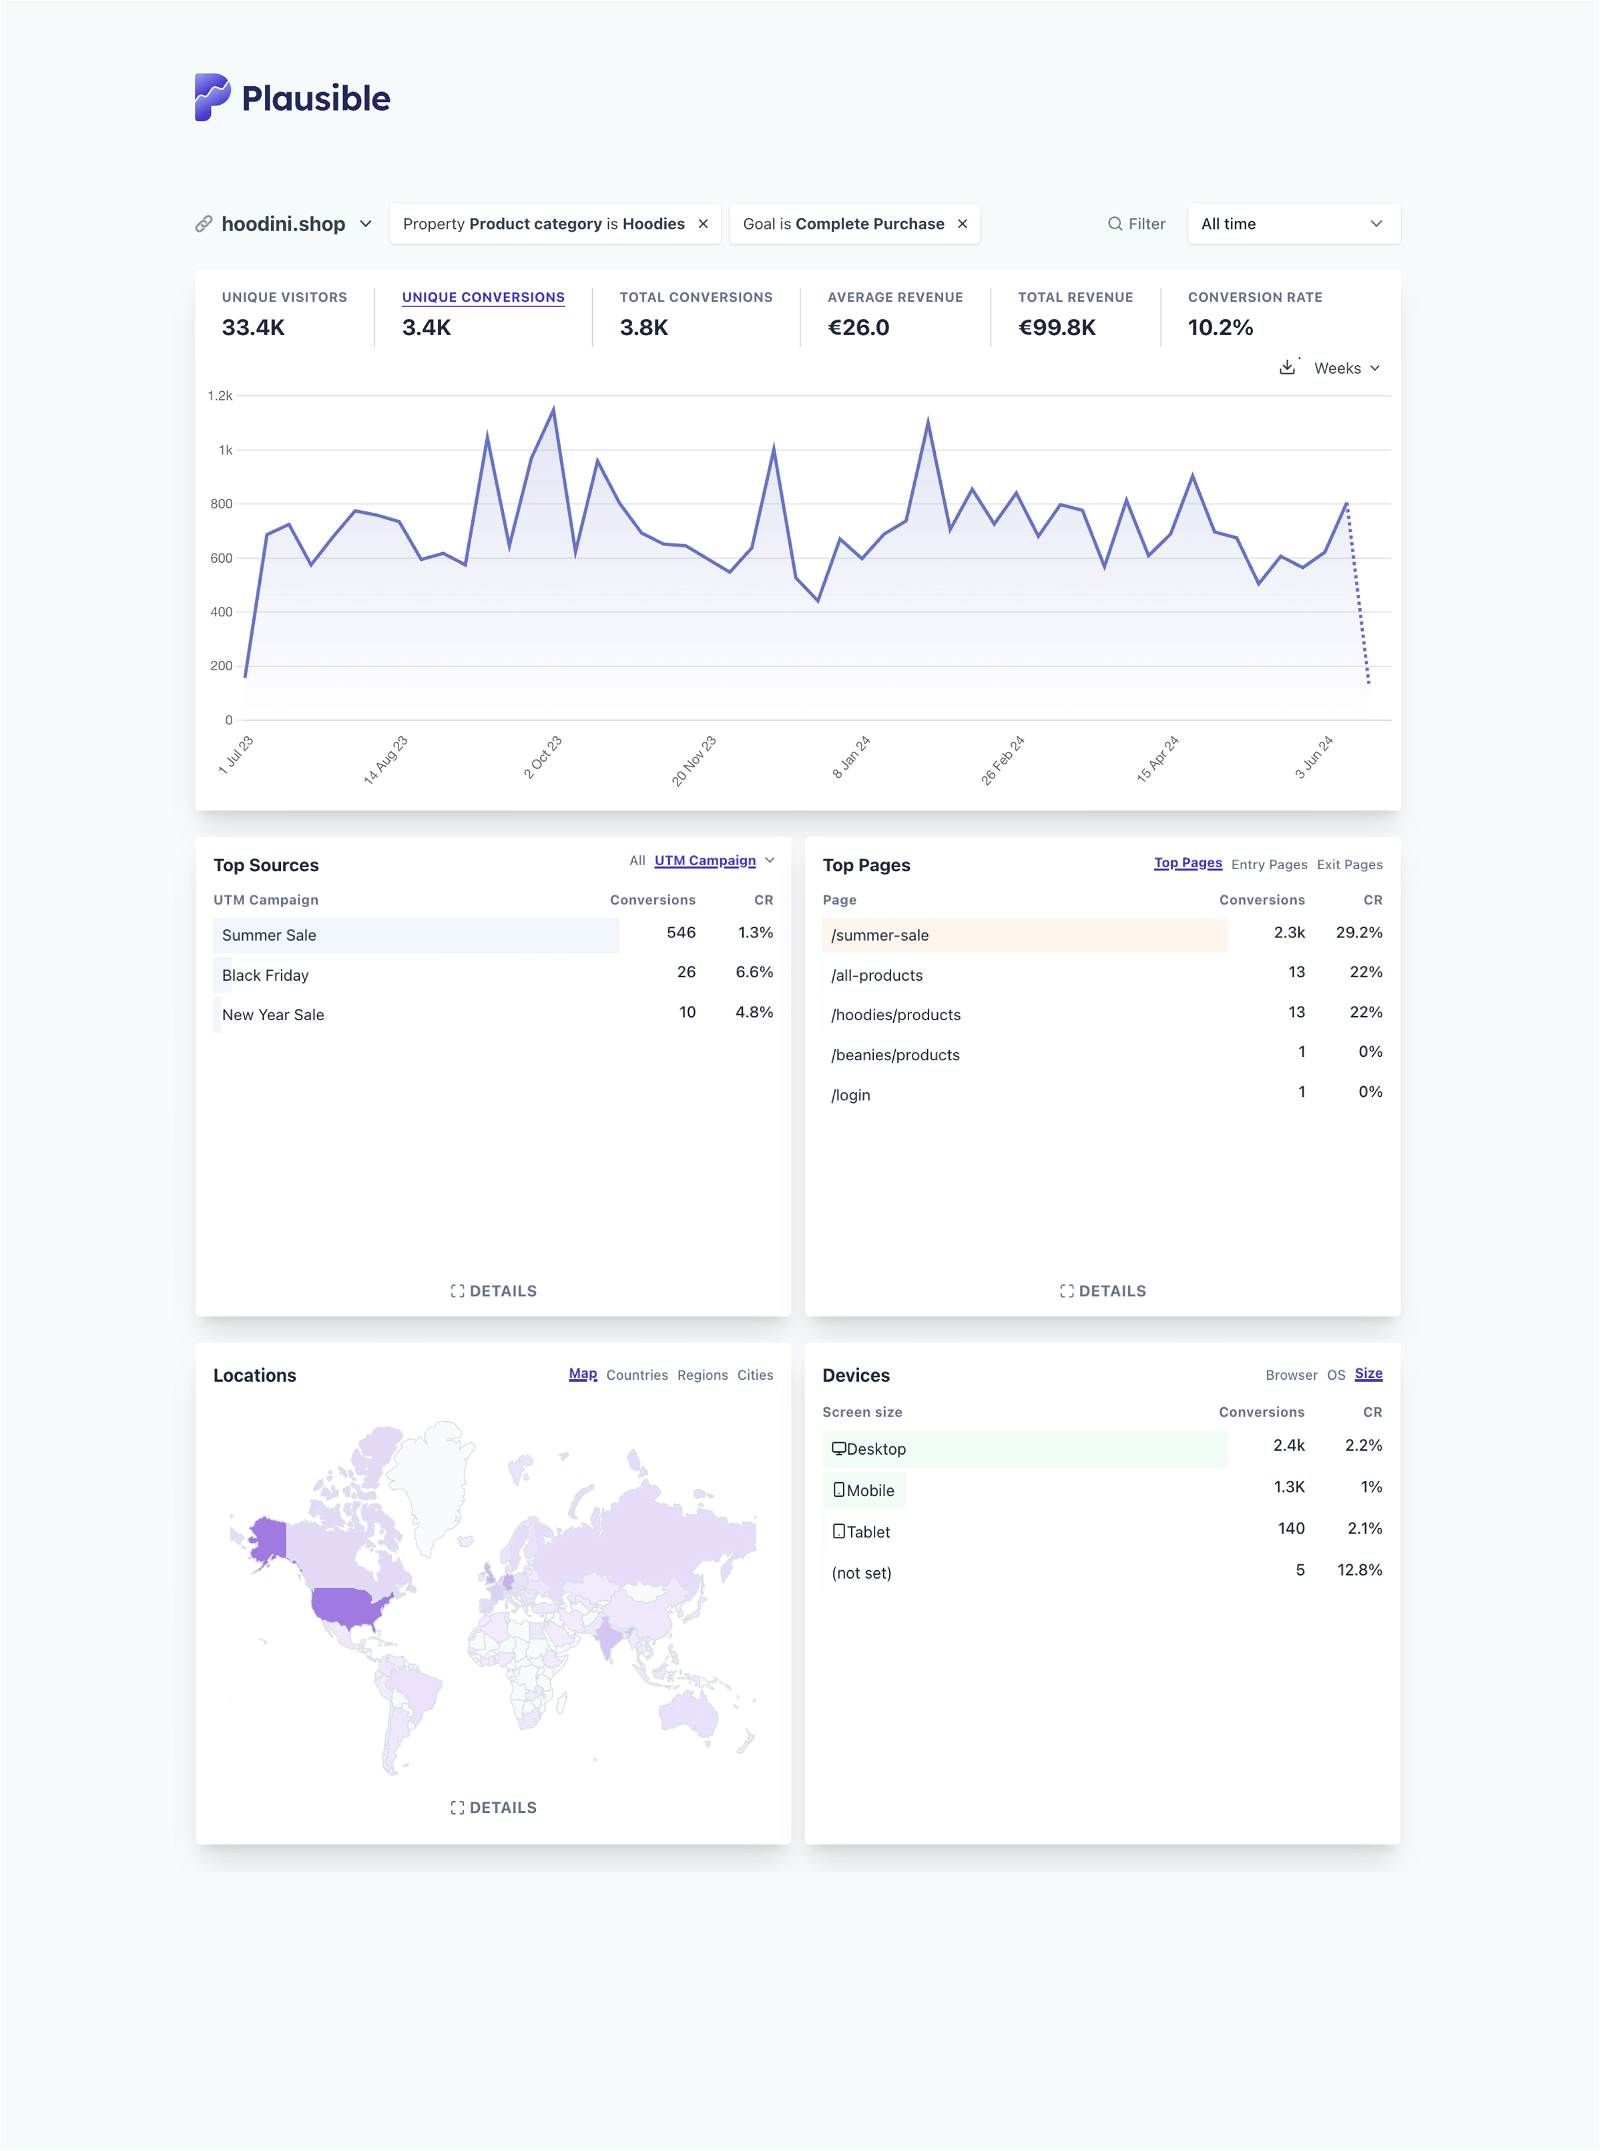
In this example, the user has their dashboard filtered by “All time” data, the goal of “complete purchase” and the property of “product category is hoodies”. So every metric they see on this single-page report is directly related to the session in which the conversions (hoodie sales) occurred.
They can see the revenue earned, the campaigns that contributed to the sale (possible due to UTM tracking), the all-time top pages that received the most traffic in the sessions receiving conversions, and some other data like locations and devices.
By toggling amongst UTM sources, mediums, campaigns, content, and terms, the user can understand the effectiveness of such traffic sources too. Similarly, they can toggle between top, entry and exit pages to understand their best performing webpages.
You can also do a ton of other stuff to understand your revenue attributions:
Making the most of Plausible
Tag your URLs with referral sources or UTM tagging, whenever using them in your ads, socials, emails, or anywhere else. This will keep your traffic from getting shown in the Direct/Unknown category, and give you a better view of the traffic sources and channels. This can later be filtered by your revenue-synced goals, revealing your top performing marketing channels. Use the UTM builder to generate correctly tagged links, or the UTM checker to validate existing ones.
Connect Plausible with your Google Search Console account to get an overview of the top performing keywords that bring your traffic from Google. This will help you understand how well your content and SEO contribute to sales.
Create funnels to understand the customer journey from landing on your site to making a purchase (during a session). The most common type of sales funnel used by e-commerce brands is “visits /product -> adds to cart -> starts checkout -> completes checkout”.
How to boost ecommerce sales using revenue attribution data?
Using web analytics to understand your shoppers’ behavior, your most popular products, effectiveness of marketing and advertising campaigns, areas of concern, etc. is very helpful, but even more effective if you use these insights in certain ways.
Maximize average order value
To do this, track the effectiveness of your CTAs, upsells, cross-sells, product pages, and checkout screens using the methods described above. And make adjustments as you see fit.
Moreover, you can learn which of your products are frequently bought together and create valuable assortments or experiment with discounts to encourage bigger purchases.
Or, you can identify the most effective incentives and reward structures to create relevant loyalty programs.
Identify/Confirm product market fit
Newer direct-to-consumer brands should use insights from revenue attribution tracking to quickly recognize what’s working and what isn’t for them. This helps with building agility in terms of experimenting with different product lines or types, messaging, marketing strategies, and audiences.
Optimize marketing ROI
When you have enough data about your marketing campaigns, you can double down on the top-performing sources and trim down the underperforming ones.
Similarly, you can maximize time on site by analyzing which website elements get the most engagement. For eg. If you learn that your customers always read technical specifications about a product, you can improve its quality by investing in product videos, or answering FAQs.
Or if you learn that a blog post about the cutting-edge uses of your new product line is very popular, then you can create similar content around the subject.
Reduce cart abandonment issues
You can use funnels to understand at which point in the shopper’s journey they mostly abandon the cart. For instance, if you find out that the drop-offs have been the highest for the past 30 days after the checkout process starts, then there may be some issue with the billing page or with the shipping fees.
And if you find out that the drop-offs happen the most before the checkout process starts, then you may want to offer additional promo codes to encourage the sale completion.
The possibilities would be endless with such insights!
Concluding
Tracking your ecommerce site is like getting intel straight from your products, search bar, wish lists, shopping carts, and whatnot, about how well shoppers are interacting with them. All that, without having to disrespect your customers’ privacy.