Segment your traffic by custom properties
1. Configure custom properties in your site settings
When you send custom properties to Plausible, they won't show up in your dashboard automatically. You'll have to configure the custom property for the numbers to show up.
To configure a property, go to the site settings in your Plausible account and visit the Custom Properties section. You should see an empty list with a prompt to add a property. You also have the option to add all properties that you've already sent with one click.
2. Filter your stats by custom properties
As soon as you've recorded at least one custom event or one pageview with a custom property attached to it, you'll be able to see an option to filter by that property in your Plausible dashboard.
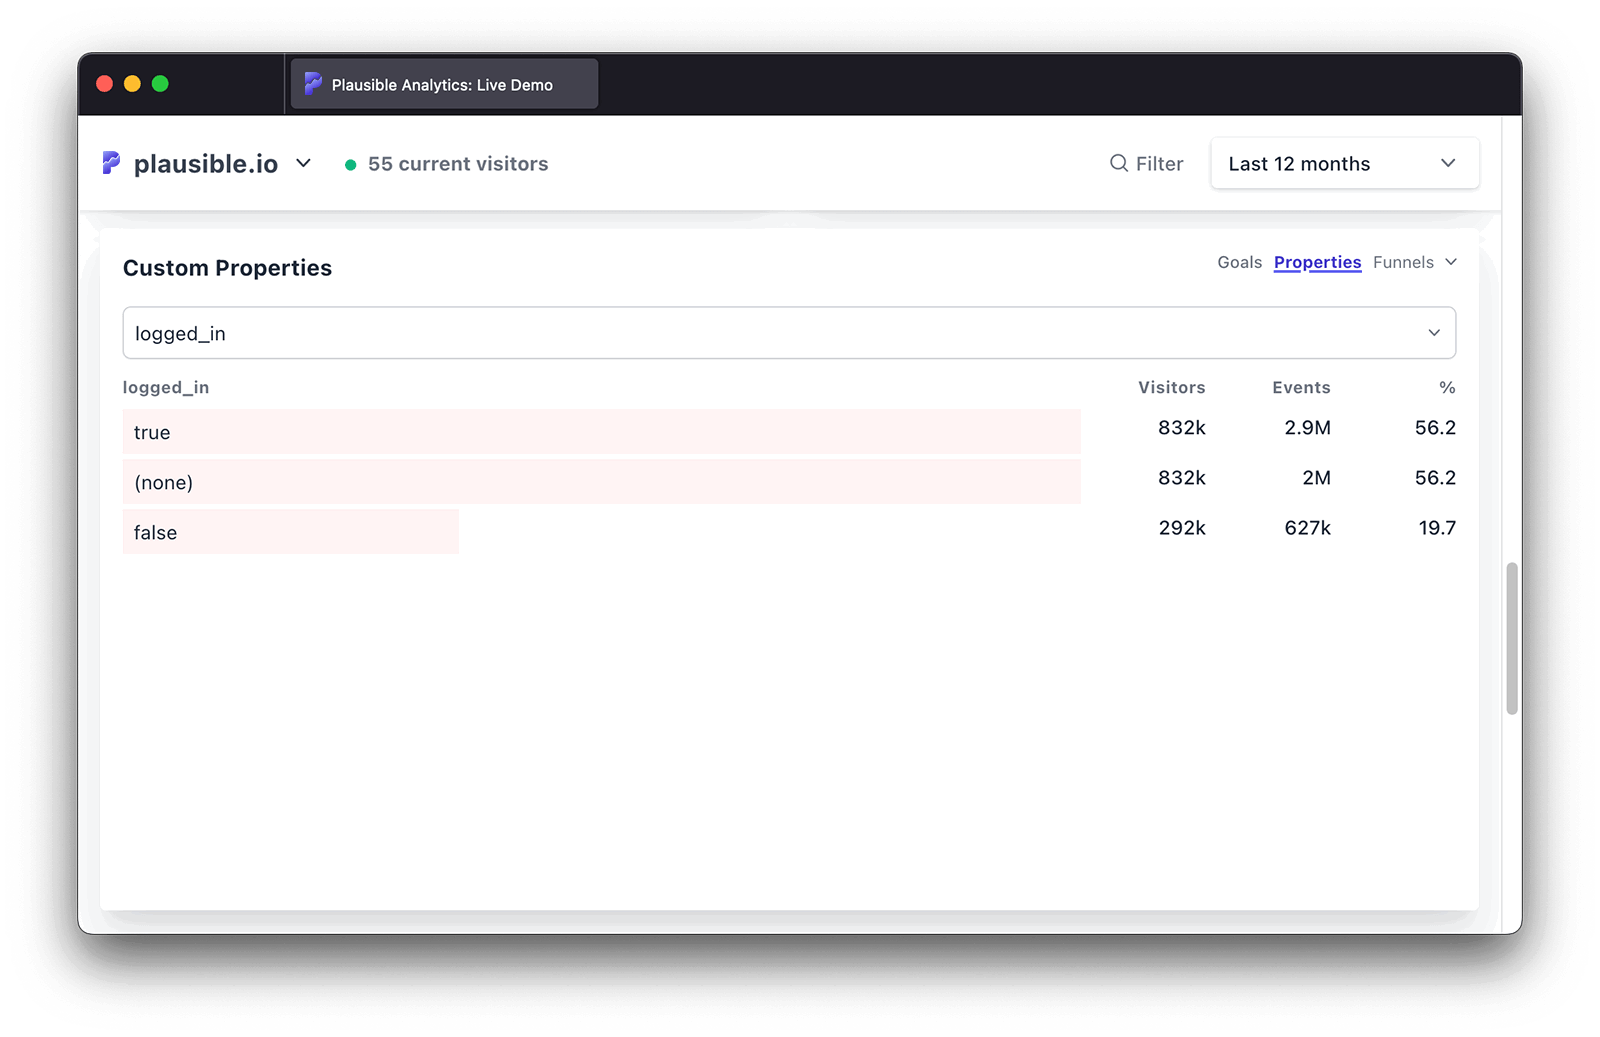
At the bottom of your dashboard, in the Goals section you can switch to the Properties tab. There you can select a specific custom property to see the related data. After you filter the dashboard by one particular custom property, you can segment your stats even further by adding additional custom properties to the filter. Keep clicking on custom properties to add more segments.
Clicking on any of your custom events in the Goals section will also take you to the Properties tab to display the properties attached to that specific custom event.
You can also use the filter menu to segment further
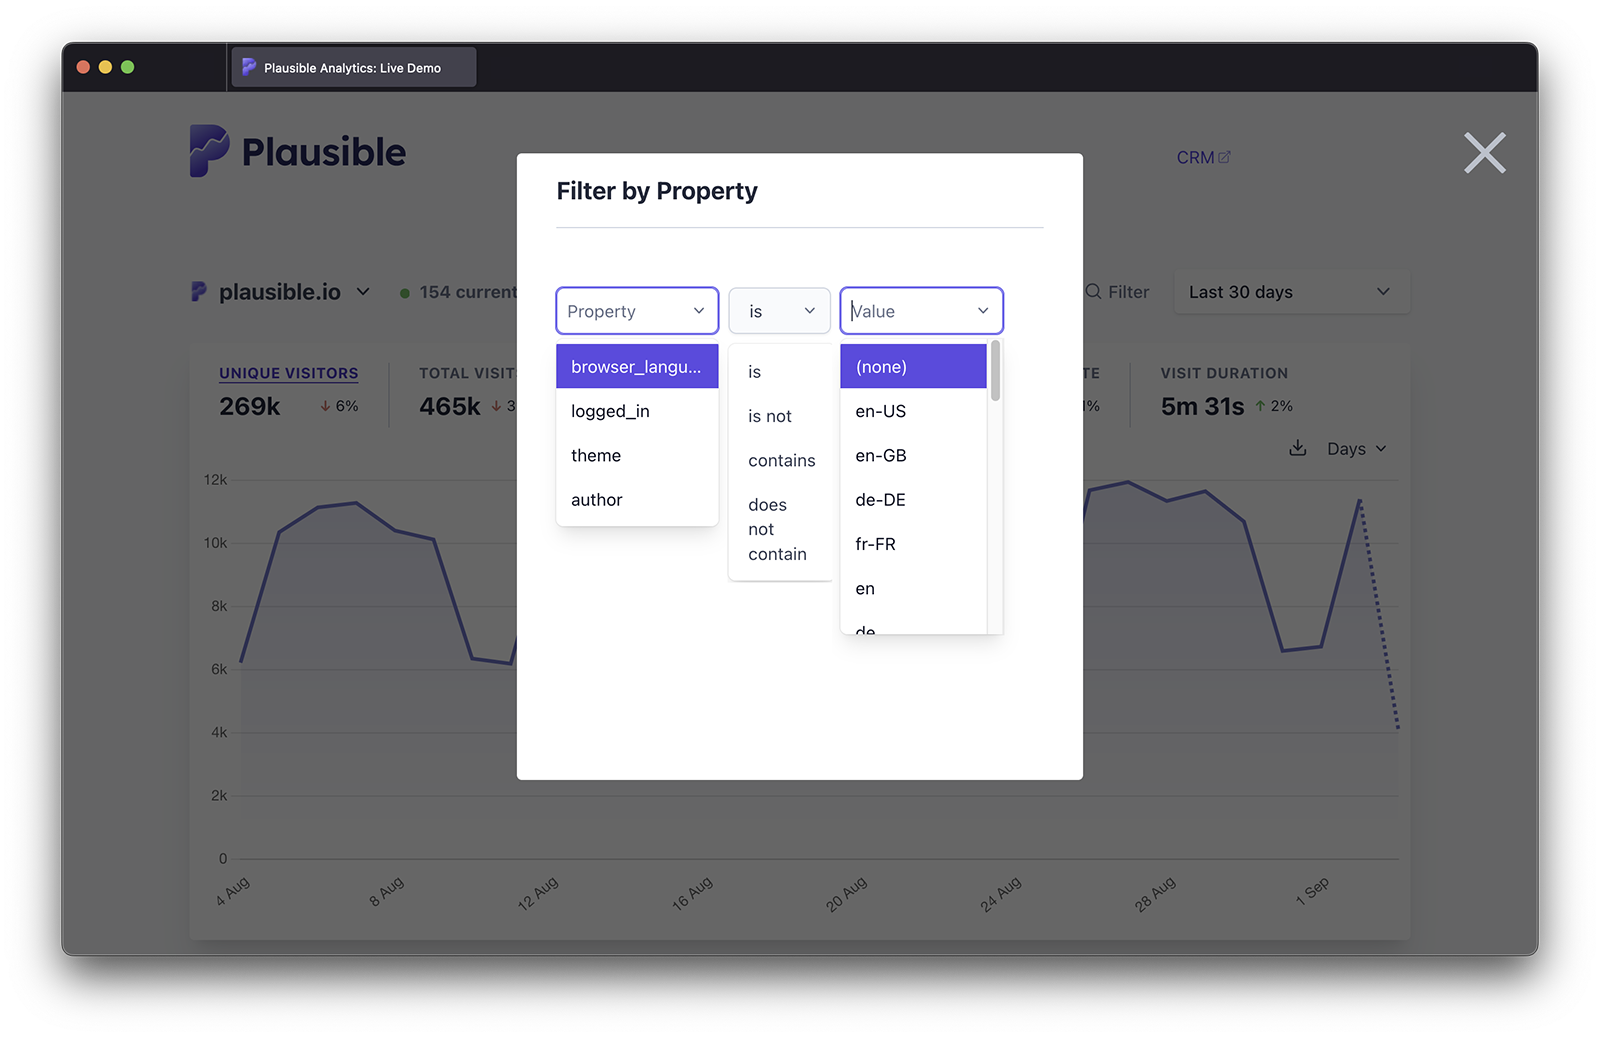
You can also open the filter dropdown menu in the top right of your dashboard and select Property.
In that view you can interact with the dropdown fields, where Plausible will automatically provide filtering suggestions based on the custom properties that we have recorded. The suggestions take into account the selected time period and other filters that you've already applied to your stats. You can choose between "is", "is not", "does not contain" and "contains" as options when selecting the custom property to filter by.
You can filter by multiple custom properties too. Click on the Add another link to add another custom property to the filter. Choose the custom properties that you want to segment your audience by and click on the Apply Filter button to filter your dashboard.