Attribution modeling is how marketing teams decide where growth really comes from. In other words, it’s about attributing the touchpoints (specific channels, campaigns, ads, etc.) that led someone to take a desired action (like purchase, sign up, etc.) in your business.
There are multiple ways of doing this, i.e., various models for assigning weightage to different touchpoints and it depends on how deep you want to go into this analysis and what suits your business.
But eventually, it’s about key business questions and informing marketing, sales, product, finance teams, etc., about budget decisions, campaign strategy, and even product direction.
- What is attribution modeling in marketing?
- Why is traditional attribution becoming less reliable?
- What is Plausible Analytics and how to use it for marketing attribution?
- How to do attribution modeling in Plausible?
- Bringing it all together
What is attribution modeling in marketing?
Attribution modeling is simply assigning credit to different interactions (touchpoints) in a buyer’s journey that lead to a desired outcome, like a signup, demo request, or purchase. For eg., did a blog post lead to awareness? Did an ad campaign nudge more people to convert? Or was it a good old email newsletter that sealed the deal?
Different Attribution models
There are largely two models:
Single-touch
- First-touch: All credit goes to the first interaction in the buyer’s journey that introduced someone to your offering/brand. It is usually useful for understanding high-level awareness drivers. Like, ads or social media content that get people to discover you).
- Last-touch (last-click): All credit goes to the interaction right before conversion. Useful for understanding what closed the deal. Like, somebody visiting the product page on your ecommerce store directly for purchasing.
Multi-touch
Credit is shared across multiple interactions. This can be evenly shared, weighted by position, or determined by a more data-driven algorithm. There are several sub-models in this type.
Each model has a purpose and a context where it’s most relevant. Which one a business uses depends on what questions they want answered.
But eventually, the goal is to answer relevant business questions like where to allocate budget, which campaign to stop, which to keep running, etc.
Why is traditional attribution becoming less reliable?
For years, attribution models relied heavily on tracking individual users across websites, sessions, and devices. The model has been that if you could follow a person’s path closely enough, you could assign credit with precision.
But third-party cookies have been restricted or eliminated by most browsers. Even user-level tracking breaks at many points due to reasons like rejected consent banners, ad blockers blocking non-privacy-respecting scripts like GA’s. As a result:
- Not every visit can be stitched to previous sessions
- Returning users may appear as new
- Cross-site journeys break
- Data gaps increase
Many attribution systems now rely on modeled estimates to fill those gaps rather than direct observation. The numbers might look precise, but they are partially reconstructed almost always.
Clarity about what you can and cannot measure
No tool can fully reconstruct every touchpoint in a modern buyer journey.
Cross-device behavior, private browsing, internal link sharing, offline conversations, and dark social, all do create blind spots.
For many teams, especially smaller B2B or SaaS companies, the question is not “Can we track everything?” but:
“Can we understand which channels and campaigns are influencing results at a reliable level?”
Choosing an attribution model based on business size and complexity
More advanced attribution systems make sense when:
- You have large paid media budgets
- You operate across too many channels
- You need account-level or multi-touch revenue modeling
- You have the data infrastructure to support it
For other teams who do not operate at that scale, a simpler attribution framework that focuses on:
- First-touch signals
- Last-touch performance
- Campaign-level analysis
- Funnel progression
…is more than often enough to guide strategy and overall direction.
What is Plausible Analytics and how to use it for marketing attribution?
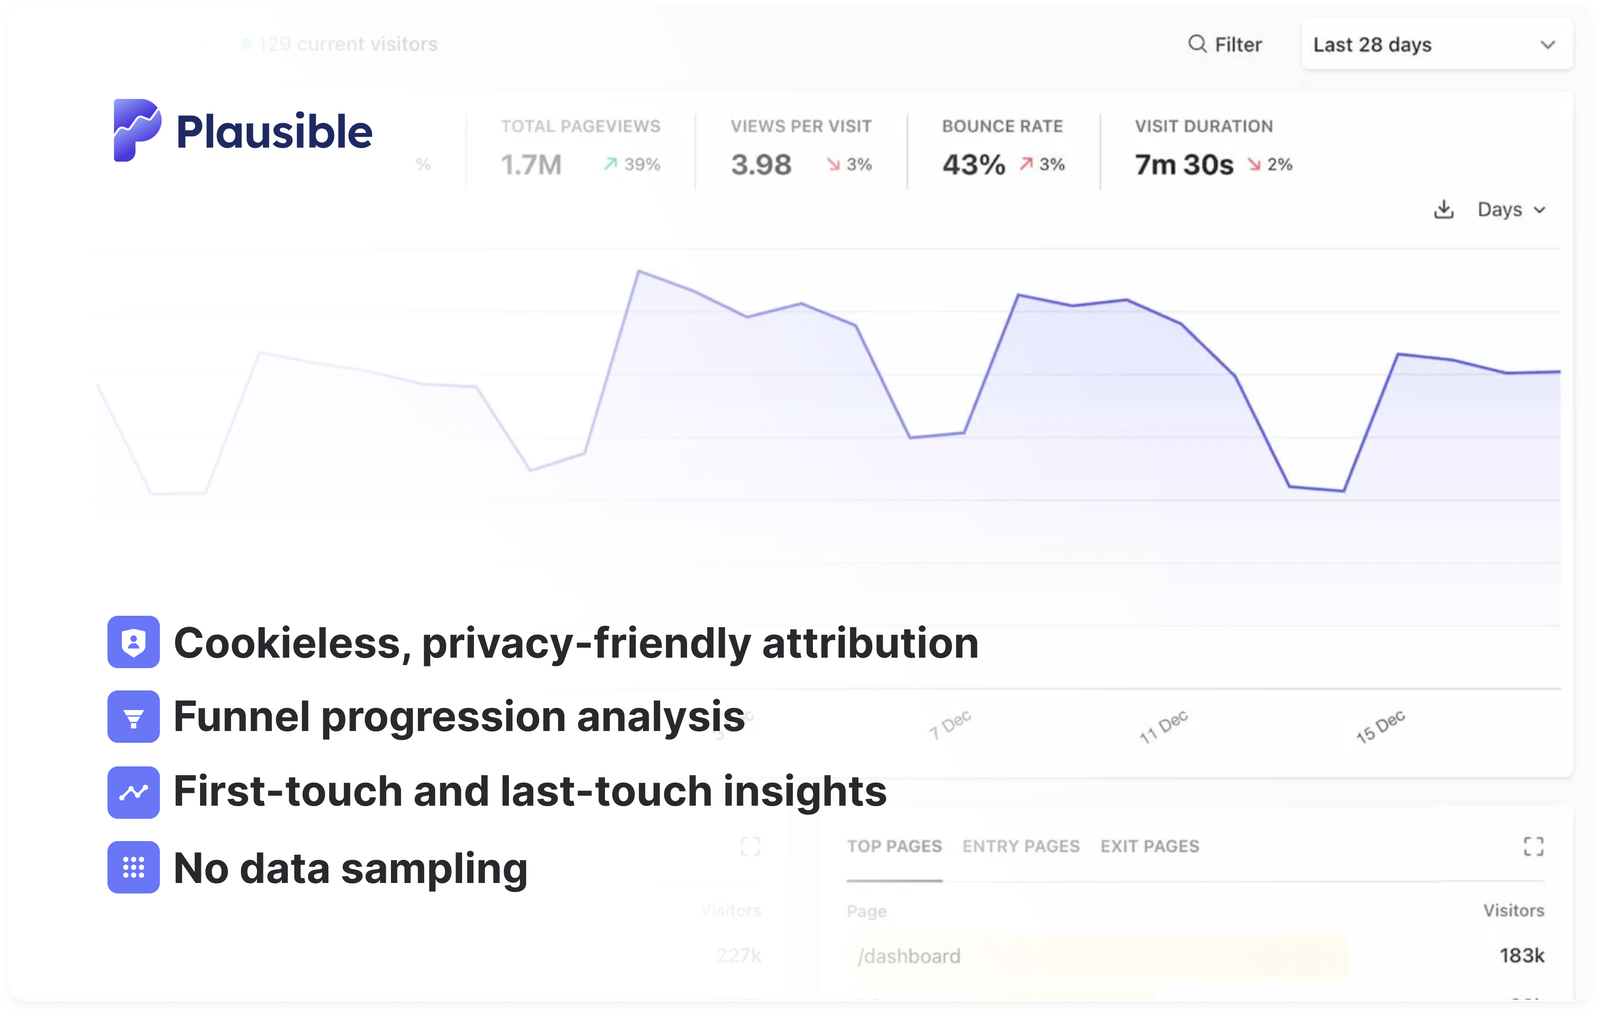
Plausible Analytics (we) is a lightweight, privacy-friendly web analytics tool designed to show how people find and interact with your website. It’s also a much simpler alternative to Google Analytics.
Since we’re privacy-first, most privacy-friendly browsers and adblockers don’t block our script, which is why our stats are much more accurate than other tracking tools.
This also means we don’t need to rely on modeled data, nor try to reconstruct complex user journeys. Everything you see on the dashboard is 100% real data.
How Plausible collects and presents data
Plausible does not use cookies or persistent identifiers. It does not track users across devices or build behavioral profiles. We track website level data and aggregated analytics only.
Take a look at our live demo but here’s an overview of the main data you can see in the dashboard:
- Unique visits, bounce rate, scroll depth, and other engagement signals
- Traffic sources and referrers
- UTM campaign parameters
- Top, Entry and Exit pages
- Goal conversions
- Location and device information
- Custom properties (aka custom dimensions)
All of this is presented in a clean dashboard without heavy modeling.
How to do attribution modeling in Plausible?
Even without user-level tracking, you can apply several practical attribution models using Plausible’s existing reports. The key is understanding how to interpret the data provided.
Below is a simple framework you can apply right away.
1. Start with clear conversion goals
Attribution only works if you define what you’re attributing. In Plausible, set up goals for meaningful actions such as:
- Demo requests
- Contact form submissions
- Signups
- Purchases
- Trial activationsetc.
Once goals are defined, every report can be filtered by conversions. This turns traffic data into attribution data.
2. Use the Sources tab for last-touch attribution
Effectively, Plausible gives you a last-touch view by default since the analytics are sessions based.
You can filter by any goal in the dashboard for any time period.
Tip: You can also filter your dashboard by specific regions or devices/browsers to add context to your analysis.
The Sources section is your most essential area for attribution.

Here you can analyze:
- Which channels drive the most conversions
- Conversion rate by source
- Campaign performance
- Referral contributions
This tells you which channels are capturing new interest and driving immediate action. Use this to answer:
- Which acquisition channels deserve more budget?
- Which campaigns are converting efficiently?
- Where are we seeing high-intent traffic?
How to use this info:
- Increase budget where conversion rates are strong
- Optimize or pause campaigns with traffic but no outcomes
- Identify high-intent channels that deserve more focus
This is especially useful for paid campaigns, email, and bottom-of-funnel activity.
3. Use Entry pages to approximate first-touch attribution
To understand what creates demand, look at your Entry pages report, while still having the dashboard filtered by the goal in question.
Entry pages show where sessions begin. When you filter by conversions, you can see which landing pages tend to start journeys that result in goal completions.

This is your practical first-touch view as you’ll discover:
- Which blog posts introduce converting users
- Which feature pages attract high-intent visitors
- Which content pieces generate qualified traffic
- Which landing pages (esp. if they’re from an ad/marketing campaign) converted
How this informs decisions:
- Double down on high-performing content topics
- Improve internal linking from strong entry pages
- Refine messaging on pages that attract traffic but don’t lead to action
This is particularly valuable for SEO, content marketing, and awareness campaigns.
P.S. Bonus read: How to analyze top landing pages and exit pages on your website?
4. UTM parameters for campaign-level attribution
UTM tagging is critical for clean campaign attribution. You can standardize parameters such as utm_source, utm_medium, utm_campaign. Use the UTM builder to generate correctly formatted links, or the UTM checker to validate and clean existing ones.
When links are consistently tagged, Plausible lets you break down conversions by campaign.
For this, keep your dashboard filtered by the goal in question, go to: Campaigns tab dropdown → Select from UTM mediums, sources, campaigns, contents, or terms, depending upon the depth/purpose of your analysis.
Now you can compare:
- Paid ad variations
- Email sequences
- Partnership traffic
- Influencer campaigns
…among absolutely anything you want to track using UTMs.
How this informs decisions:
- Scale winning campaigns
- Reallocate budget from underperformers
- Test variations with clearer performance benchmarks
This layer is often the most actionable because it directly informs where marketing spend should increase or decrease.
5. Use funnels to understand progression
Plausible does not reconstruct multi-session journeys, but you can build funnels by stitching together goals to understand if and how many visitors are moving between key steps, what and where the dropoffs are, etc.
For open-ended path analysis, you can also use User Journeys to see what visitors did before or after a conversion. We explain the strategy and examples in our guide to website journey analytics.
Here are some funnel examples:
- Blog post → Pricing page → Signup
- Landing page → Demo request
- Feature page → Contact form
Then segment funnels by source or campaign.
This helps you identify:
- Which channels drive deeper engagement
- Where drop-offs happen
- Which paths convert at higher rates
What to do with this info?
- Improve underperforming steps in the funnel
- Adjust landing page messaging
- Focus acquisition on sources that drive deeper progression
This also adds behavioral context to your source-level attribution.
Taken together, this gives you:
- A demand capture view through sources
- A demand creation view through entry pages
- A campaign optimization layer through UTMs
- A behavioral layer through funnels
Without needing user-level tracking or complex multi-touch modeling.
For teams that require deeper modeling, Plausible data can be exported and layered into broader analytics systems, making it a clean acquisition-level input rather than a closed environment. Check out our APIs, export options, and Data Studio Connector for this purpose.
Bringing it all together
Attribution modeling does not have to be complicated to be useful. Many teams make meaningful decisions about budget allocation, content strategy, paid campaigns, and website optimization using the framework given above.
New here? Learn more about us. And start your free trial here (no CC needed).