Website Journey Analytics: How to track user journeys on your website
People do not experience your website one page at a time. They arrive with a goal, move between pages and events, get answers, get stuck, compare options, drop off, or convert. User journey data helps you see those paths instead of looking at each page in isolation.
Someone may first find a blog post from Google, visit your homepage, check the pricing page, read the docs, and then sign up. Someone else may land directly on a product page, click through to a comparison page, and contact sales in the same visit.
It is a practical subset of customer journey analytics (that often joins CRM, support, email, ads and offline touchpoints) for website teams.
- What is website journey analytics?
- How user journeys compare to other analytics methods
- What you can learn from visitor paths
- How to track user journeys on your website
- GA4 Path Exploration vs Plausible User Journeys
- Bringing it all together
What is website journey analytics?
Website journey analytics is the process of analyzing the sequence of pages and events visitors go through on your website.
It helps you answer questions like:
- Where do people go after landing on the homepage?
- Which pages do visitors view before signing up?
- What path leads people from a blog post to the pricing page?
- Do visitors from a specific campaign behave differently from organic search visitors?
- Where do visitors drop off after viewing a key page?
- What happened before a form submission, trial signup or purchase?
and so on. Even if you don’t have any questions beforehand, you can do open-ended exploration to discover new paths and behaviors.
In other words, it gives you the context around your website traffic.
How user journeys compare to other analytics methods
There are a few similar-sounding concepts in this area. The difference is mostly about scope and intent.
Customer journey analytics
Customer journey analytics usually looks across many touchpoints: ads, email, CRM, sales, support, product usage and website visits. Plausible User Journeys focuses only on the paths visitors take on your website.
For example, it can show what visitors did after landing on your pricing page, but it will not combine that with sales calls or support tickets.
User journey mapping
A user journey map is a visual artifact a team creates to understand an experience. User Journeys is based on live website behavior: the pages and events visitors actually move through.
For example, a journey map may show the expected path from homepage to signup, while User Journeys may reveal that many visitors go through a blog post, docs or comparison page first.
Funnels
Funnels are for measuring a path you already know and seeing drop-off between steps. User Journeys is for discovering paths you did not know to measure, or working backwards from a conversion.
For example, use a funnel to measure Homepage -> Pricing -> Signup. Use User Journeys when you want to see which pages people visited before signing up.
What you can learn from visitor paths
Here are some useful ways:
See what visitors do after landing on key pages
Your homepage, pricing page, comparison pages, docs, feature pages and top blog posts are not just individual pages but starting points.
Journey data helps you see what visitors do after those pages.
For example:
- Do homepage visitors go to pricing, docs, product pages or blog posts?
- Do pricing page visitors continue to signup or leave?
- Do blog visitors explore the product or only read and exit?
- Do docs visitors go back into the app, contact support, or stop there?
This is helpful for improving page structure and internal linking. If visitors are not taking the next step you expected, the page may need clearer calls-to-action, better navigation, or more relevant links.
Work backwards from conversions
Conversion path analysis is the other side of the same question.
Instead of starting from a page and asking “what happened next?”, you start from a goal and ask “what happened before?”
For example:
- Which pages did visitors view before signing up?
- Which blog posts or docs pages appeared before a trial activation?
- Did people visit the pricing page before contacting sales?
- Which pages led to a purchase?
This is especially useful for content marketing and SEO. A blog post may not directly convert many visitors on the first pageview, but it may still appear in journeys that eventually lead to signup or purchase.
Without journey data, that content can look less valuable than it is.
Understand drop-offs
Not every visitor will continue to another page or trigger an event. That is normal.
But when many visitors stop after a key page, it is worth investigating.
For example:
- Visitors reach the pricing page but do not continue to signup
- Visitors open docs but do not return to the product
- Visitors hit a 404 page and leave immediately
- Visitors from a paid campaign land on a page and take no further action
In Plausible User Journeys, for instance, this is shown as “No further action” at each step. It helps you see where visitors stopped moving through the tracked journey.
No further action is not always bad. Someone may leave after getting exactly what they needed. But if the page is supposed to lead to a conversion, a large drop-off can be a useful signal.
Compare journeys by traffic source, campaign, device or country
The same page can perform differently for different audiences.
Visitors from Google search may read more content before converting. Visitors from paid campaigns may go straight to pricing. Mobile visitors may drop off earlier than desktop visitors. Visitors from a certain country may prefer different pages or product information.
This is why journey analysis becomes more useful when combined with filters and segments.
For example, you can compare:
- Organic search journeys vs paid campaign journeys
- Mobile journeys vs desktop journeys
- US visitors vs UK visitors
- Newsletter visitors vs social media visitors
- Visitors from a specific UTM campaign
This helps you avoid treating all traffic as one big average.
Examples by website type
Different teams can use the same journey data in different ways:
- SaaS teams can work backwards from a signup or trial goal to see which comparison, pricing, docs or feature pages visitors viewed before converting. If those pages keep appearing in conversion paths, they may deserve clearer CTAs, stronger internal links and regular updates.
- Content and SEO teams can start from a top blog post and see what visitors do next. If most visitors take no further action, the post may need better product links or a stronger next step. If visitors continue to a related feature page, the topic may be attracting qualified traffic.
- Ecommerce stores can work backwards from purchases to see which product, category or campaign pages appeared before checkout. They can also compare paid and organic journeys, or check where mobile visitors drop off.
- Agencies can make client reports more concrete by showing how visitor paths changed: more visitors reaching pricing from SEO pages, a campaign driving traffic but no further action, or a refreshed page sending more visitors toward conversion.
How to track user journeys on your website
If you want a simple and privacy-friendly way to track user journeys on your website, Plausible User Journeys is built for this.
It lets you explore the actual paths visitors take through your site without extra setup, cookies or personal profiles. You just pick a page or goal and see what visitors did next. Or you can start from a conversion goal and work backwards to see what led visitors there.
You can see it in action right now, on our own public analytics dashboard, by scrolling down to the “Explore” tab.
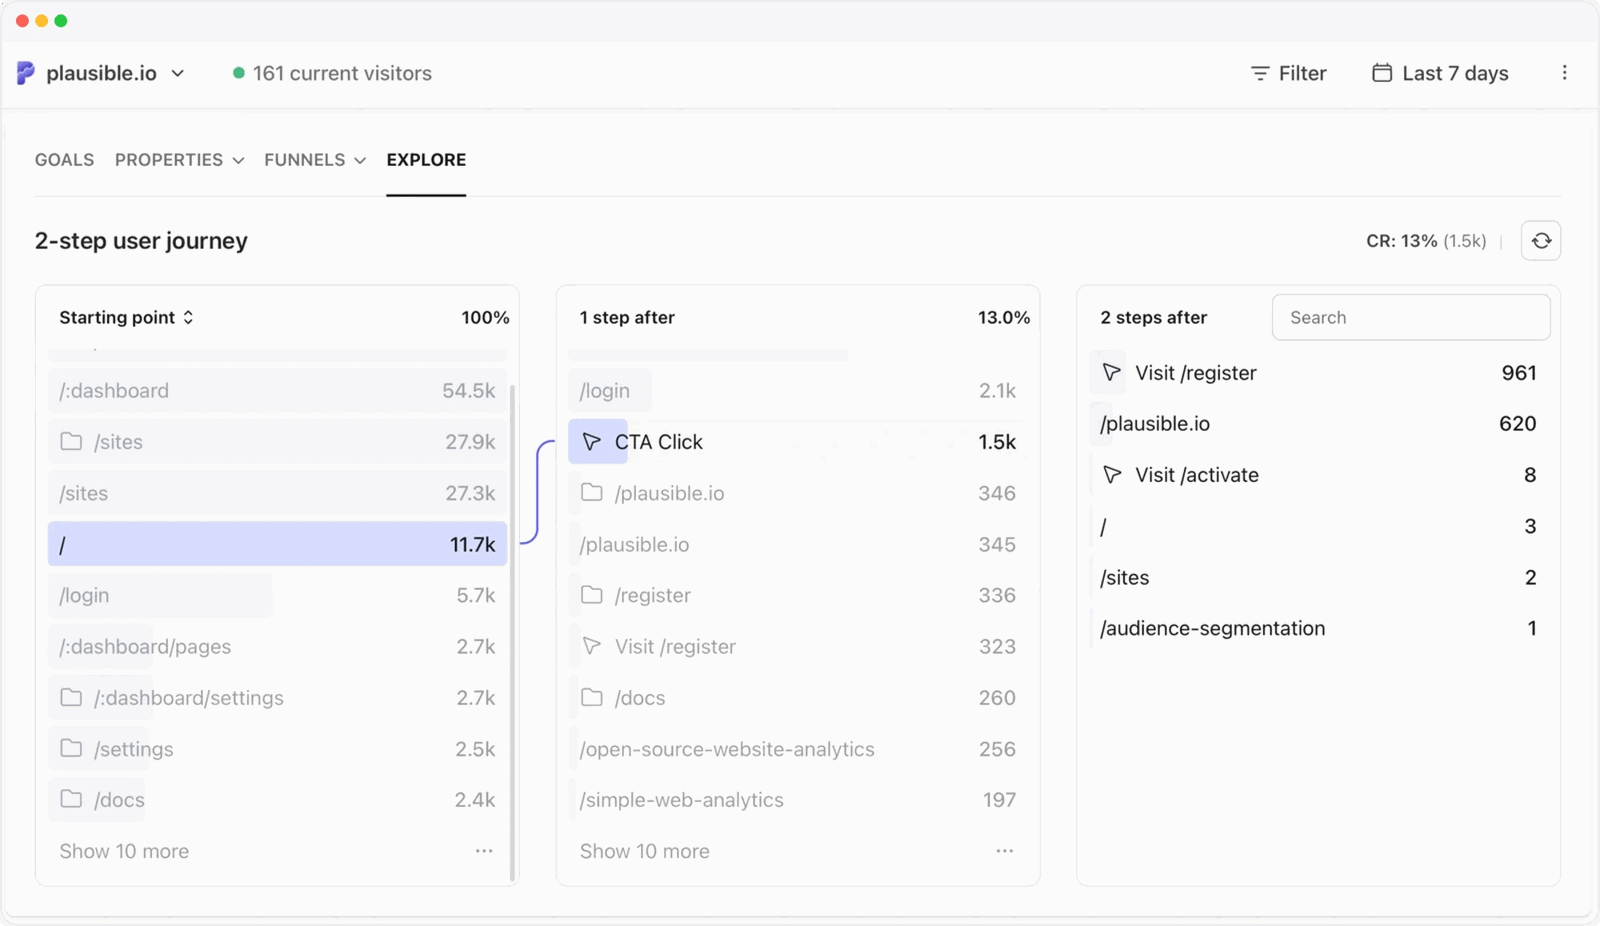
How Plausible User Journeys works
User Journeys is available in the Explore tab alongside Goals, Properties and Funnels. It works with the pages and events already in your dashboard and you don’t need to work with code or even turn on any settings. It’s always there in your single-page dashboard.
You can explore journeys in two directions:
- Starting point: Begin with a page or event and see what visitors did next.
- End point: Begin with a conversion goal and work backwards to see what led visitors there.
For example, you can select a signup goal as the end point and see which pages and events visitors went through before reaching it.

In Plausible, goals can be pageviews such as a thank-you page (codeless setup), custom events such as a signup button click, or optional measurements (plug-and-play) such as form submissions, outbound link clicks, file downloads.
Each column shows one step in the path. Click any entry to keep exploring, and Plausible will load the next step. You can go up to 20 steps, and the conversion rate updates as you build the selected journey.
You’ll also find grouped pages from the same directory to reduce noise. For example, individual blog posts might be grouped under /blog, and documentation pages under /docs. This makes it easier to see section-level patterns instead of getting lost in hundreds of individual URLs, while you can still do individual URL analysis if needed.
Dashboard filters also apply to User Journeys. So you can narrow paths by:
- Traffic source
- Campaign
- Country
- Device
- Landing page
- Any other available dashboard dimension
This helps you compare how different audiences move through your site. For example, you can check whether visitors from a paid campaign go from the landing page to signup, whether mobile visitors drop off earlier than desktop visitors, or whether visitors from a specific country take a different path through your docs or pricing pages.
GA4 Path Exploration vs Plausible User Journeys
Google Analytics 4 has a Path Exploration report. It is powerful, but it lives inside GA4’s Explorations area (custom reporting), which means you need to configure dimensions, node types, segments and events before getting to the answer.
That may be fine for data scientists. But for many website teams, it’s overly complicated and time-consuming.
You’d usually even be missing about half your data with Google Analytics, because its script is commonly blocked by ad blockers and majority of visitors decline consent banners.
If you just want simple and effective answers to questions like:
- What did visitors do after viewing this page?
- What happened before this conversion?
- Where did people stop?
- Does this source or campaign follow a different path?
then Plausible User Journeys is built into the same dashboard where you already analyze pages, sources, goals, funnels, devices and locations.
Bringing it all together
Journey analysis helps you move from isolated metrics to real behavior.
You can still look at pageviews, sources, bounce rate, visit duration and goals. But when you add journeys, you see how those pieces connect.
You can understand where visitors start, what they do next, what happens before conversions, and where they take no further action.
If you want to explore the paths visitors take on your site, open the Explore tab in Plausible and try User Journeys.