Annotations
Annotations let you pin notes to specific dates directly on your traffic chart. A product launch, a campaign going live, a site outage, a big press mention: anything that might explain a change in your data.
When you spot a spike or a drop, annotations tell you why it happened. The context is right there on the chart.
Personal and team annotations
There are two types of annotations:
- Personal notes are visible only to you. Use these for notes that are relevant to your own workflow but not worth surfacing to the whole team.
- Site notes are visible to all team members who have access to the dashboard, as well as anyone viewing through a shared link.
Where annotations appear
Annotations show up as markers along the bottom of the main traffic chart. When the date of an annotation falls within your selected time range, the marker appears on the chart. Hover over a marker to read the note attached to it.
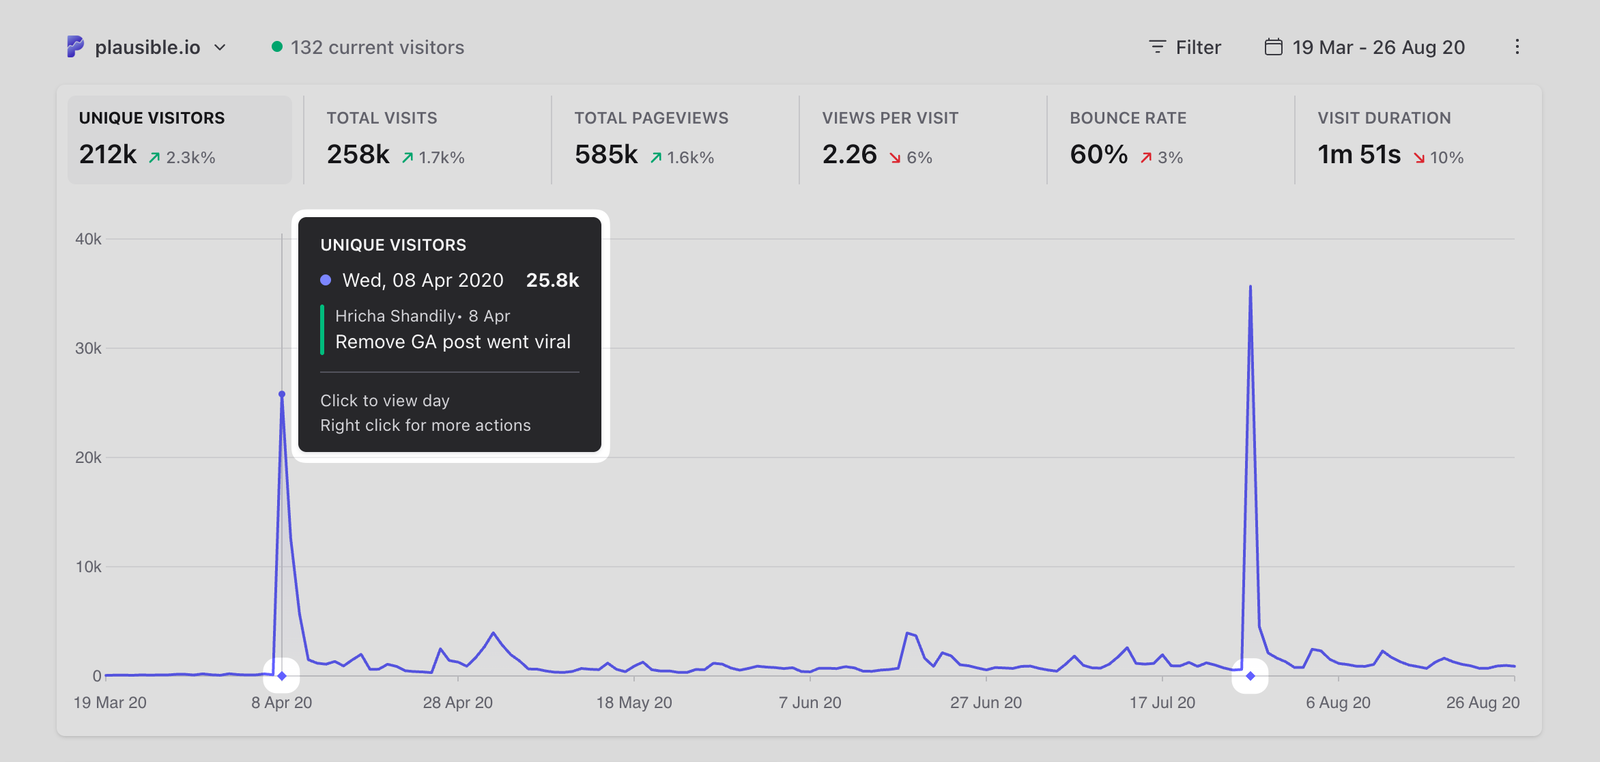
Add an annotation
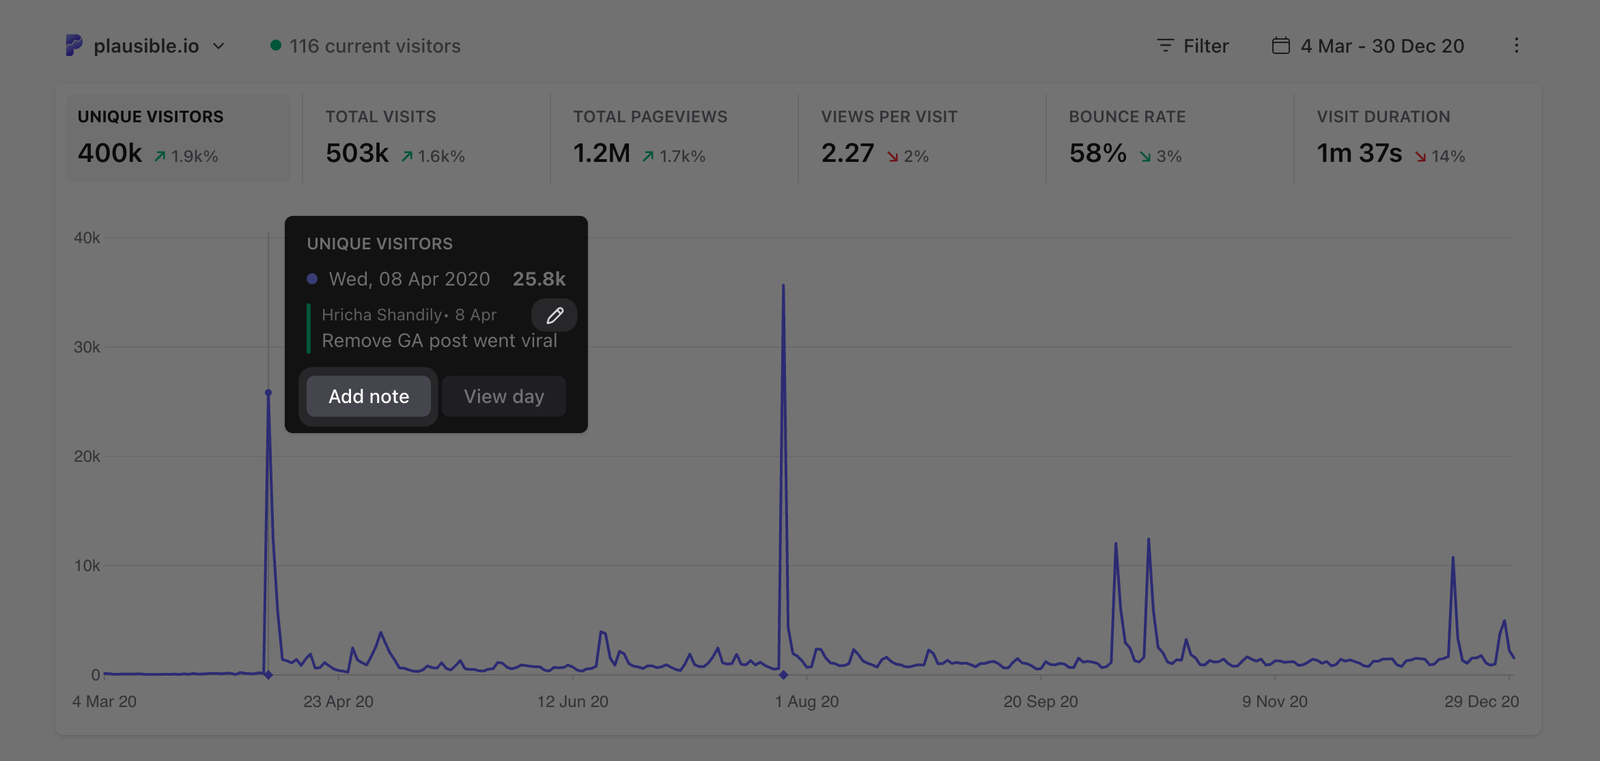
Hover over the date on the chart where you want to place the annotation. Right-click to open the context menu and select Add note. Write a short note describing the event and choose whether it should be personal or shared with your team. Save it and the annotation will appear on the chart immediately.
Edit or delete an annotation
Hover over the date on the chart where an annotation exists. Right-click to open the context menu and choose to edit the note or delete the annotation entirely. You can always edit or delete your personal annotations. Only team members with editor access or above can add, edit or delete site annotations.
Limits
Each site can have up to 500 annotations. Personal notes and site notes from all team members count towards the same limit. Each note can be up to 255 characters long.
Practical uses
Annotations are most useful when your team is making changes that affect traffic. Some common things worth marking:
- Deployments: a significant change to the site that might affect page speed, structure or conversion rate
- Marketing campaigns: when a paid campaign, newsletter or social post goes live
- SEO changes: publishing new content, updating meta data or restructuring URLs
- Technical incidents: a downtime period, a tracking issue or a misconfigured redirect
- External coverage: a press mention, a viral post or a spike from an unexpected source
- A/B tests: start and end dates for experiments that affect traffic or conversion behavior
Annotating these events means future you (and your teammates) can read the chart without having to dig through Slack, commit history or email threads to understand what changed.
Annotate events as they happen rather than after the fact. A note added on the day of a deployment is more useful than one added a week later when you're trying to explain a traffic change.