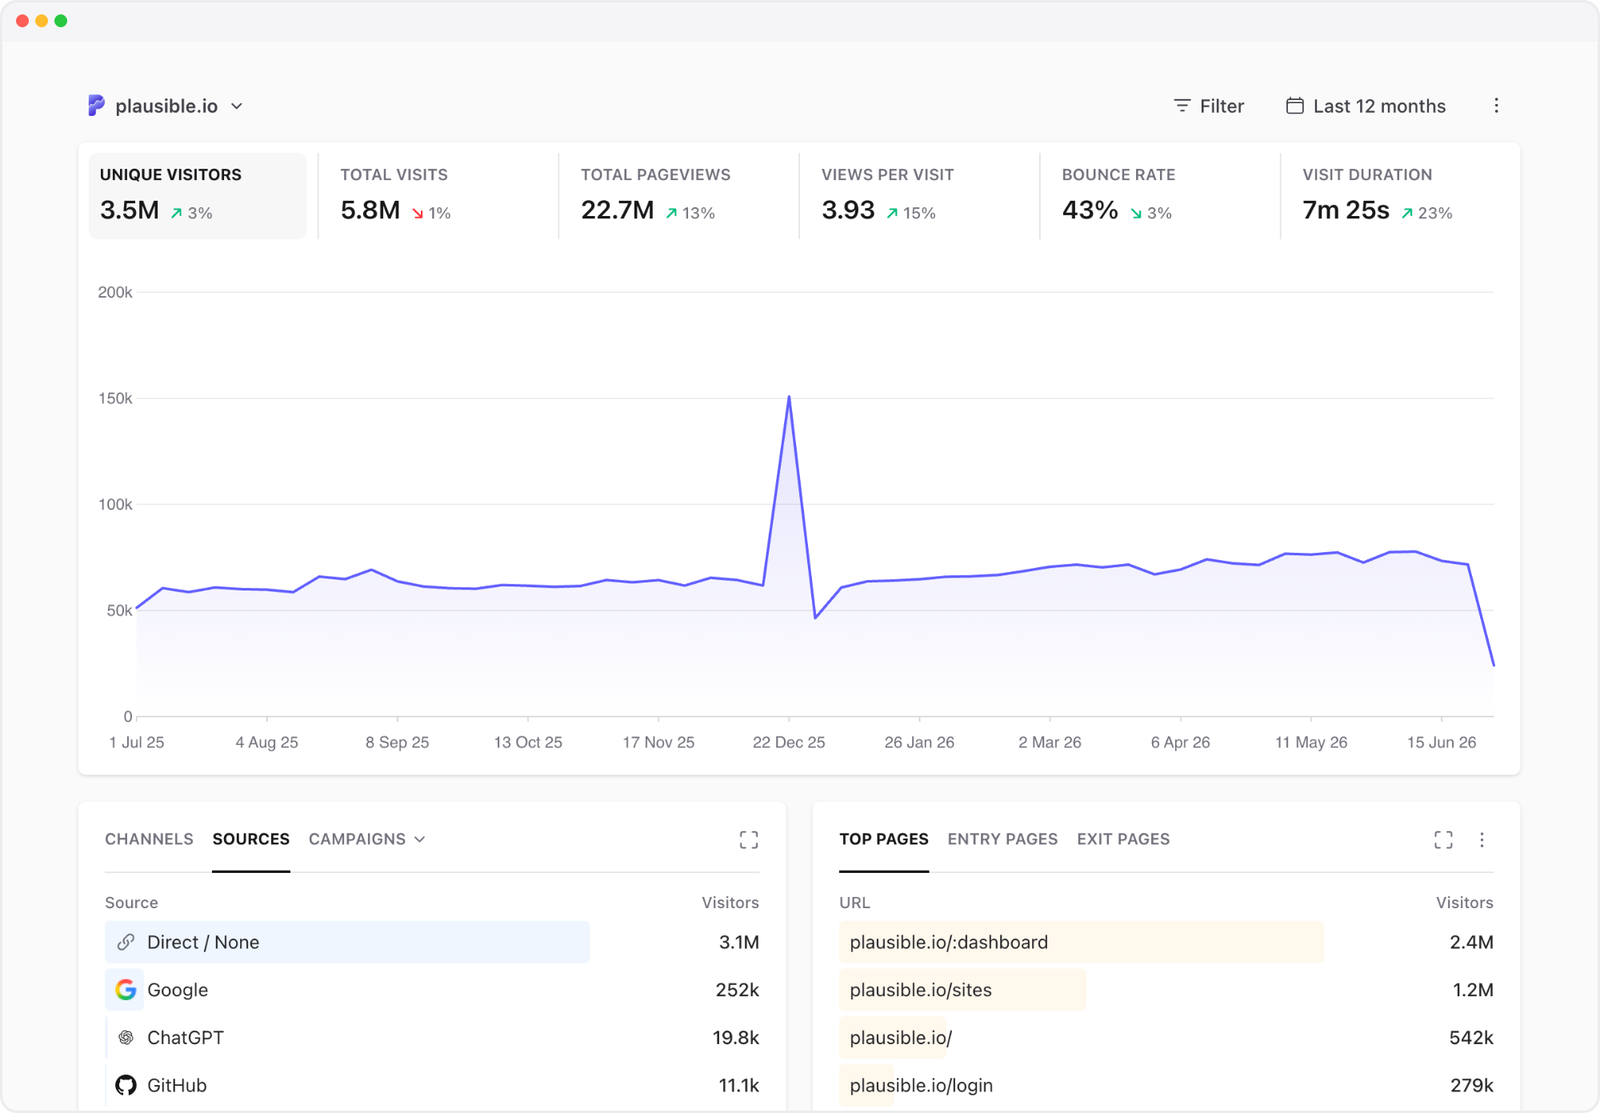
Checking your website traffic can sound like a matter of finding one number. In practice, it starts with a more useful question: are people finding the site, and what happens when they do?
The most accurate way to answer that question is to install a web analytics tool on the site you own. This gives you first-party data based on visits that actually happened, rather than an outside tool’s estimate.
This guide helps you set up measurement, learn to read the dashboard, and gradually turn raw traffic into something you can act on. The examples use Plausible Analytics, but the same basic questions apply to any web analytics.
- 1. Install analytics on your website
- 2. Choose a useful date range
- 3. Check visitors, visits and pageviews
- 4. Find where your traffic comes from
- 5. Check which pages people visit
- 6. Check campaign traffic with UTM parameters
- 7. Check conversions and goals
- 8. Diagnose a traffic spike or drop
- Why a public traffic checker can never measure your site accurately
- A simple weekly website traffic check
1. Install analytics on your website
Before you can interpret traffic, you need somewhere reliable to record it. A website traffic checker can only estimate a site’s traffic numbers; it cannot tell you exactly how many people visited. For that, your website needs to send data to an analytics platform.
Most analytics tools do this using a small JavaScript snippet. You add the snippet to the <head> of every page you want to measure. Depending on how your site is built, you may instead use an official plugin, an integration, or a tag manager.
The exact setup depends on the analytics tool and how your site is built, but the basic process is usually:
- Add your website to the analytics tool.
- Copy the tracking snippet or select the relevant integration.
- Add it to your website, either directly or through your content management system, framework or tag manager.
- Visit your website and verify that your visit appears in the dashboard.
If you are using Plausible, our installation guides cover popular platforms and frameworks.
Make sure your analytics is working
After installing analytics, it is a good practice to check that it is receiving visits. You can open your website in a private window, visit a page, and look for that visit in your tool’s real-time report. If it appears, your basic tracking is working.
Some tools make this easier. Plausible, for example, has an automatic integration verification tool that checks whether the tracking script is installed correctly. You can also run it again from your site settings after changing your setup.
If your test visit does not appear, use our tool-independent guide to checking whether analytics is working. It covers common causes as well as less-common setups involving single-page applications and subdomains.
If tracking works but your totals differ from Google Analytics, Search Console, an advertising platform or another source, that does not automatically mean something is broken. These tools measure different things in different ways. Our guide to why analytics numbers do not match explains how to interpret those differences.
Once visits are coming through, resist the urge to judge the first number you see. A traffic total only becomes meaningful when you place it in time.
2. Choose a useful date range
The useful date range depends on what prompted you to open the dashboard. Are you checking a campaign you launched this morning, reviewing an ordinary month, or wondering whether the site has grown over the past year?
- Use Today or Last 24 hours to check a launch, active campaign or sudden incident.
- Use Last 7 days for recent operational changes.
- Use Last 30 days for a steadier view of normal performance.
- Use 6–12 months to see seasonality and long-term direction.
Turn on a comparison with the previous period or the same period last year. “10,000 visitors” has little meaning on its own. “10,000 visitors, up 18% from the previous 30 days” gives you context.
In Plausible, the date picker lets you compare your selected range with the previous period, the same period a year earlier or a custom period. See the documentation on comparing your stats over time.
Use a same-length previous period to understand recent momentum, and a year-over-year comparison to see how the site has changed over a longer cycle. Comparing the same dates across years is also useful for separating real growth from seasonal effects. For example, comparing December with November could make a retail site look unusually strong; comparing it with the previous December gives you a fairer view of its growth.
With that context in place, you can read the headline numbers without mistaking normal fluctuation for a meaningful change.
3. Check visitors, visits and pageviews
Start with visitors, visits and pageviews. Together, they move you from how many people came, to how often they came, to how much they explored.
| Metric | What it tells you | Simple example |
|---|---|---|
| Visitors | How many distinct people or devices visited during the selected period | One person visits twice: one visitor |
| Visits or sessions | How many separate browsing sessions happened | The same person returns later: two visits |
| Pageviews | How many pages were loaded | They view three pages in each visit: six pageviews |
For example, a visitor who loads five pages during one session generally produces one visitor, one visit and five pageviews. If that person returns in a separate session, visits increase again. The exact definitions vary: analytics products use different identification methods and session rules, so numbers from two tools should not be expected to match exactly.
If you are looking at a Plausible dashboard, the metrics definitions explain exactly how each number is calculated.
Which metric matters most depends on your question:
- Use visitors to understand audience size.
- Use visits to understand how often the site is used.
- Use pageviews to understand how much content was consumed.
- Use views per visit, visit duration and bounce rate to add engagement context.
Do not treat pageviews as people. A documentation site may have many pageviews because visitors need several pages to solve a problem. A single-purpose landing page may succeed with one pageview if the visitor submits the form or buys the product.
These totals tell you the size and shape of the activity, but not what created it. The next question is where those visitors came from.
4. Find where your traffic comes from
Open the Sources or Acquisition report. This turns an anonymous traffic total into a more understandable story: people may have discovered you through a search, followed a recommendation, clicked a campaign, or returned directly.
In Plausible, these reports sit together under Sources. This guide to channels, sources and campaigns explains how incoming traffic is classified and how to move from a broad channel to a specific referrer or campaign.
Depending on your analytics tool, traffic may be grouped into channels such as:
- Organic Search
- Direct
- Referral
- Organic Social
- Paid Search or Paid Social
- Affiliates
- AI referrals
Start with channels for the broad picture, then drill into exact sources. If Organic Search grew, was it Google, Bing or another search engine? If Referral traffic spiked, which site linked to you? If AI traffic increased, did it come from ChatGPT, Perplexity or another service?
Our guide to AI traffic analytics explains how to connect those referrals to landing pages, engagement and conversions.
“Direct” does not always mean someone typed your address into the browser. It is the fallback when reliable referral or campaign information is missing. Bookmarks, untagged emails, private messages, apps, redirects and links that strip referral information can all appear as Direct.
To judge traffic quality, click a source to filter the rest of the dashboard. Then check its landing pages, engagement and conversions. The source with the most visitors is not necessarily the most valuable source.
For search queries, connect Google Search Console or view its Performance report. Analytics tells you what visitors did after arriving; Search Console tells you which Google queries and pages produced impressions and clicks. Plausible users can connect Search Console to bring those queries into the dashboard.
Knowing where someone came from gives you one half of the journey. To understand what drew them in, and whether the visit delivered on its promise, you need to pair the source with the page they reached.
5. Check which pages people visit
Your pages reports continue the story from acquisition into behavior. They answer three related questions:
- Top Pages: Which pages received the most views?
- Entry Pages or Landing Pages: Where did visits begin?
- Exit Pages: Where did visits end?
Plausible’s pages report guide shows where to find these views and how to filter the rest of the dashboard by a page.
Start with entry pages when evaluating acquisition. A landing page with growing traffic may have gained search visibility, been shared, or received a campaign push. Filter by that page and check which sources delivered its visitors and whether those visitors converted.
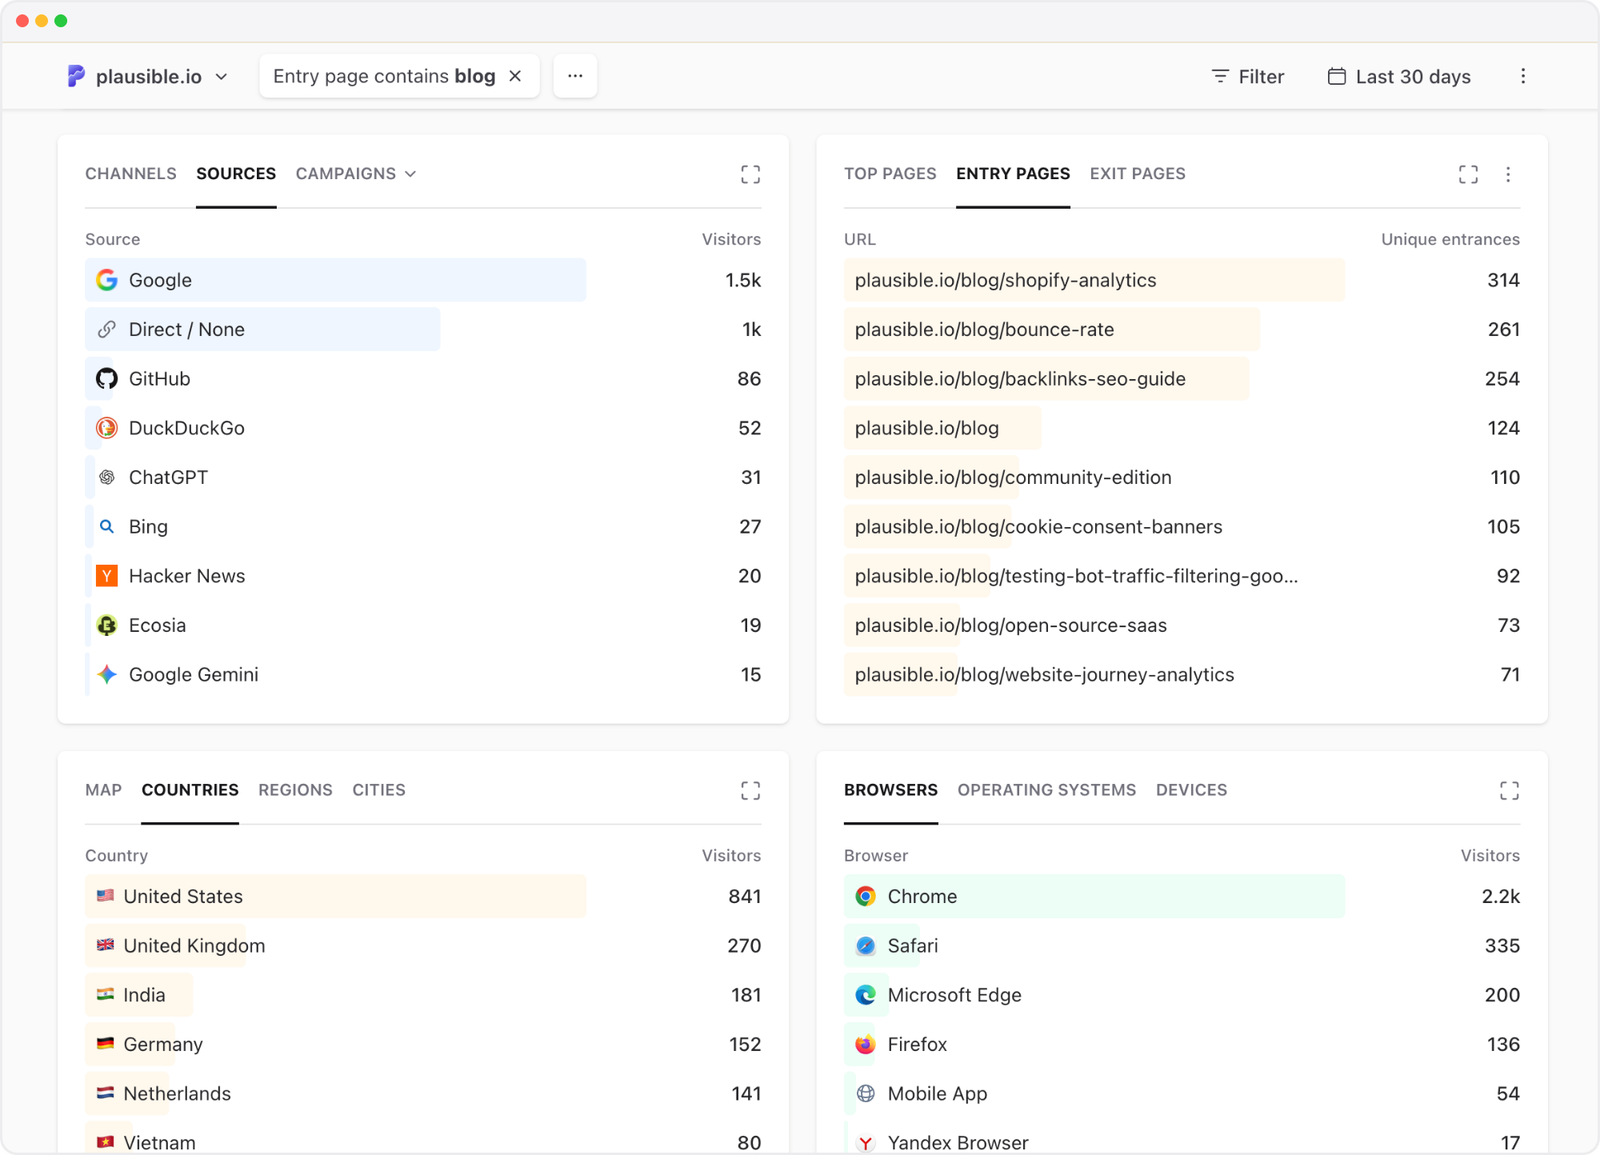
Use Top Pages to see what people consumed after arriving. Review engagement alongside traffic: a high-traffic page with poor engagement and no conversions may attract the wrong audience, fail to answer the query, or simply do its job quickly. Context matters.
Exit pages are clues, not automatic problems. Every visit has to end somewhere. An exit from a thank-you page can signal success, while frequent exits from the first step of checkout deserve investigation.
Our guide to analyzing landing pages shows how to combine page, source and conversion data.
Sometimes the source and landing page are enough to explain a visit. But when you are responsible for the link, such as an ad, newsletter, QR code or social post, you can make that trail much clearer before the visitor even arrives.
6. Check campaign traffic with UTM parameters
That is the role of campaign tagging. Referral data alone is not enough for reliable campaign tracking. Links in email, apps, QR codes, documents and private messages may otherwise be recorded as Direct, and a platform name alone cannot distinguish one campaign from another.
UTM parameters are labels added to the destination URL. A tagged link can look like this:
https://example.com/pricing?utm_source=newsletter&utm_medium=email&utm_campaign=summer-launch&utm_content=top-button
The five standard parameters are:
utm_source: the specific platform or sender, such asnewsletter,linkedinorgoogleutm_medium: the type of marketing, such asemail,socialorcpcutm_campaign: the initiative, such assummer-launchutm_content: the creative or link variation, such astop-buttonutm_term: commonly used for a paid-search term or another useful targeting label
At minimum, use a consistent source and campaign name. Lowercase values and a shared naming convention prevent Newsletter, newsletter and news-letter from fragmenting your reports.
If UTM tagging is new to you, this guide to UTM parameters explains how the tags work and how to name them consistently. You can then create correctly formatted links with our free UTM builder. After people click them, open the Campaigns report and drill into source, medium, campaign, term or content. Then filter by the campaign to see the pages viewed, engagement and goals completed by those visitors.
Tip: Never add UTMs to ordinary internal links on your own site. Doing so can overwrite the visitor’s original acquisition information and split one journey into misleading campaign data.
Now you can connect a visit to the effort that brought it in. But traffic, even perfectly attributed traffic, is not the final outcome. The next step is to ask whether the visitor did something valuable.
7. Check conversions and goals
Traffic tells you that people arrived. Conversions tell you whether the visit accomplished something that matters to the visitor, to your organization, or ideally to both.
A conversion might be:
- Reaching a thank-you or order-confirmation page
- Submitting a lead or contact form
- Signing up for a trial or newsletter
- Completing a purchase
- Downloading a file
- Clicking a key button, outbound link or email address
etc.
In Plausible, you can configure a pageview goal for a destination such as /thank-you, or use a custom event for actions that do not create a new pageview. The goal conversion guide walks through both options. Ecommerce and subscription sites can also attach revenue data to suitable conversion events.
Once goals are collecting data, check both conversions and conversion rate. A source may bring fewer visitors but convert a much larger share of them. Filter by a goal to see which sources, campaigns, landing pages, countries and devices are associated with the result.
Test every goal yourself after setup. Confirm that one real action produces one conversion, the event name is correct, the value or currency is right where relevant, and routine page loads do not trigger the goal accidentally.
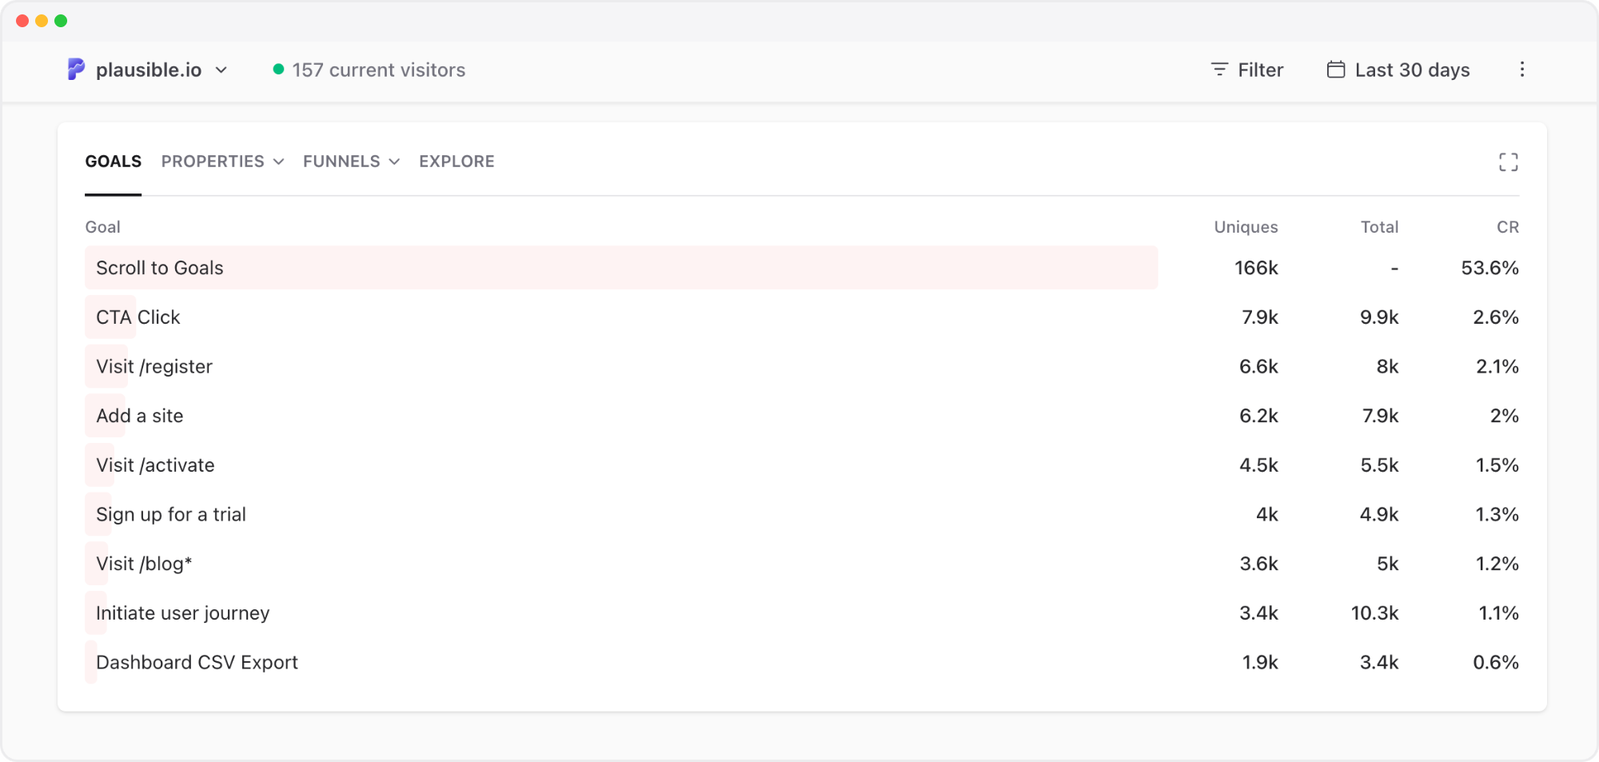
At this point, the dashboard is no longer just a counter. You can trace a line from acquisition to behavior to outcome. That same line becomes especially useful when something suddenly looks wrong or unexpectedly good.
8. Diagnose a traffic spike or drop
When traffic changes suddenly, it is tempting to jump straight to an explanation. Instead, retrace the path you have just built: confirm the measurement, establish the timeframe, identify the affected metric, then narrow the change by source, page and outcome.
Start by confirming that the data is trustworthy. Do not begin rewriting content or increasing ad spend until you have ruled out a tracking issue.
Work through these checks in order:
- Confirm the timing. Find the day or hour the change began and compare it with a normal period.
- Check the analytics setup. Look for a removed or duplicated script, a recent site release, consent changes, a domain or subdomain change, broken single-page-app tracking, or a new exclusion rule.
- Separate visitors, visits and pageviews. If only pageviews changed, navigation or duplicate tracking may be responsible. If all three moved, the audience probably changed.
- Find the affected segment. Is the change sitewide or concentrated in one source, campaign, page, country, device or browser?
- Check engagement and conversions. A spike with almost no engagement or conversions may be bot or spam traffic. A drop in traffic with stable conversions may be less serious than it first appears.
- Match the dates to real events. Check launches, newsletters, ad budgets, press coverage, social posts, outages, holidays and seasonal demand.
- Investigate search separately. Use Search Console to compare clicks, impressions, queries, pages, countries and devices. Check for ranking changes, indexing problems, algorithm updates and changes in search demand.
Add annotations for launches, site releases and campaigns so future changes are easier to explain. Keep a simple record of what changed, when it changed and which segment moved.
For a deeper checklist, read how to investigate a drop in website traffic. If the graph moved in the other direction, see our guide to investigating a traffic spike.
Why a public traffic checker can never measure your site accurately
If you have searched for a quick way to measure your traffic, you have probably found public tools that ask you to enter a domain. It is important not to mistake their output for your real website data.
These tools can be useful for rough competitor research, but they do not have access to a site’s analytics account. They are estimating from the outside rather than measuring visits as they happen. That is why installing analytics is essential when you want to understand your own site.
Many SEO tools estimate organic search traffic using the keywords a site ranks for, the estimated number of searches for each keyword, its ranking position and an assumed click-through rate. They then add those predicted clicks together. This can provide a useful indication of a site’s visibility in search, but it does not count visits from direct traffic, social media, email, referrals or offline campaigns.
Some products, including Semrush Traffic Analytics and Similarweb, also estimate total traffic and its channel mix. They use samples of browsing activity, often called clickstream data, along with statistical models and other public data to estimate direct, social, referral, search and other traffic. These reports cover more than search, but they are still projections from a sample rather than actual visits recorded on the website itself. Estimates are especially less dependable for small or niche sites where the provider has little data.
So, before using a public traffic number, check what it represents. An organic traffic estimate and an estimated total visits figure are not interchangeable.
| First-party analytics | Competitor traffic estimate |
|---|---|
| Collected from real activity on a site you control | Modeled from sources available to the provider |
| Can show pages, campaigns, events and conversions recorded on your site | May show estimated search traffic or modeled traffic across several channels |
| Useful for operating and improving your own website | Useful for rough benchmarking and discovering competitors |
| Affected by your setup, consent approach, bot filtering and blocked scripts | Affected by the provider’s data coverage and model; smaller sites can have sparse or volatile estimates |
An estimate is not necessarily “wrong” because it differs from your analytics. It simply answers a different question with different data. Even first-party tools can disagree because they define visitors and sessions differently, filter bots differently, and may be blocked at different rates.
For measuring your own site, the takeaway is simple: use a well-configured first-party analytics tool as your main source and validate important outcomes, such as purchases or signups, against your own records.
Use public estimates only for rough competitor comparisons, not to measure your website.
A simple weekly website traffic check
You do not need to analyze every report every day. In fact, repeatedly refreshing a dashboard often creates anxiety rather than insight. A calm weekly routine is enough for most websites:
- Set the last seven days and compare with the previous seven days.
- Check visitors, visits and pageviews for unusual movement.
- Review sources and campaigns to see what caused the change.
- Review entry pages to see where acquisition grew or declined.
- Check conversions and conversion rate to judge traffic quality.
- Investigate only the segments that changed materially.
- Add an annotation for any launch, campaign, outage or site update.
The goal is not to collect the largest possible number of metrics. It is to keep hold of that trustworthy chain from where people came from, to what they viewed, to what they did next, and to notice when any part of that story meaningfully changes.
To see how these reports work together, explore the Plausible live demo alongside the guided dashboard tour. You can filter the dashboard by sources, pages and goals without creating an account.
When you are ready to measure traffic on your own site, you can start a free trial.